Harnessing the Google Maps JavaScript API the Right Way

This article was peer reviewed by Tim Severien, Nuria Zuazo and Mallory van Achterberg. Thanks to all of SitePoint’s peer reviewers for making SitePoint content the best it can be!
![]()
Google Maps is an online mapping service providing up-to-date road maps, business listings, directions, street-level photos and more.
There are notable alternatives to Google Maps, such as Mapbox and Open Street Map. But in my view, none of the competitors can match up to Google Maps for the sole reason of the completeness of its business directory. Google is able to present a complete and vast map equipped with up-to-date business details, thanks mainly to the crossover with their search offering.
There are various APIs for interacting with Maps, from the simple Static API to the powerful JavaScript API, which is the focus of this article.
Of course, you can place Google Maps on your site without leveraging the various APIs on offer. This makes life easier, of course, and still offers a lot of useful features. But the Maps JavaScript API gives us full control over our map for performance and customization purposes.
Harnessing the Google Maps JavaScript API
In this article, I’d like to show you how to make the most of the Maps JavaScript API — using it the right way.
There are lots of tutorials and examples already out there for this, but too often without a focus on the best way of achieving the desired result. They get things done quickly, but without a considered approach or explanation of why certain steps have been taken.
The complete source code for this article can be found on our GitHub repo.
Creating a Basic Map Canvas
The first thing we need to do is set up a simple front-end framework for building the mapping application.
Create the HTML
Let’s create an HTML file with the following markup:
<!DOCTYPE html>
<html lang="en">
  <head>
    <meta charset="utf-8">
    <meta http-equiv="X-UA-Compatible" content="IE=edge">
    <meta name="viewport" content="width=device-width, initial-scale=1">
    <title>Google Maps API Template</title>

    <link rel="stylesheet" href="style.css" />
  </head>
  <body>
    <div id="map"></div>

    <script src="script.js" defer></script>
  </body>
</html>
This gives us a robust platform for building a full mapping application.
Notice how we’ve used the defer attribute for our script. This tells the browser to download the specified scripts as soon as possible, but to wait until HTML parsing has finished before executing them. It’s important to use defer whenever possible, as it will prevent the rendering of the page from halting before it’s finished in order to execute JavaScript code — providing a janky loading experience for the user. The eagle-eyed reader may notice how we haven’t included Google Maps’ JavaScript: this is deliberate, and will be explained shortly!
Build the on-ready callback
Now, let’s set up our initial JavaScript file, script.js, starting with the document.addEventListener('DOMContentLoaded', function () {}) call:
document.addEventListener('DOMContentLoaded', function () {
  if (document.querySelectorAll('#map').length > 0)
  {
    if (document.querySelector('html').lang)
      lang = document.querySelector('html').lang;
    else
      lang = 'en';

    var js_file = document.createElement('script');
    js_file.type = 'text/javascript';
    js_file.src = 'https://maps.googleapis.com/maps/api/js?callback=initMap&signed_in=true&language=' + lang;
    document.getElementsByTagName('head')[0].appendChild(js_file);
  }
});
The #map length check is a quick way to find out if a certain element is present on the current page. Quite often, the same external JavaScript file will be included on an entire website, and quite often some portions of code are only required for certain pages. In this instance, we only ever want to execute this code if we’re presenting a map canvas to the user. This prevents unnecessary code bloat on pages that don’t require it. (Performance matters!)
Once we’re sure we have a map canvas on the page, we may think we’re ready to proceed, but there’s one more check we should perform. By default, the Google Maps JavaScript API loads in English, regardless of what language the requesting page is in. A great way to counteract this is to set a lang variable based on the lang attribute in the <html> element. This will allow us to include the Google Maps JS in the correct language for our user. This is especially useful for multilingual (i18n) websites that include the same script.js file across all languages.
Grabbing Google’s JavaScript file
Now comes the time to load the external Google Maps JS file. The reason we’ve left it until now, rather than including it as a regular <script> tag in the HTML, is to prevent unnecessary code bloat in pages that don’t have a map canvas. To load in the file, we create a new <script> element and inject it into the <head> of the DOM. As Google’s API handles callbacks for us, we don’t need to do anything more fancy than this:
var js_file = document.createElement('script');
js_file.type = 'text/javascript';
js_file.src = 'https://maps.googleapis.com/maps/api/js?callback=initMap&signed_in=true&key=YOUR_API_KEY&language=' + lang;
document.getElementsByTagName('head')[0].appendChild(js_file);
There are a few interesting things to note in the query string parameters passed to the API.
Firstly, we pass our lang variable as the language parameter to instruct Google on which language we want the map to be in.
Secondly, we provide the signed_in parameter as true. This is to increase the personalization of the map (e.g. it will have your starred locations visible, amongst other things).
Next, we pass the key parameter with our API key (more on that shortly).
Finally, and most importantly, we specify our callback function using the callback parameter. This tells Google which of our functions it should trigger once the file has been fetched successfully.
Google Maps JS API will still work without a valid key parameter. However, we would be issued with a JavaScript error console warning message. So we should make sure we get ourselves a free API key by following Google’s guide.
Initializing the map canvas
Now that we’ve got our initialization function call set up, we can move on to defining our callback function initMap(). This is the function that the Google Maps JS API will trigger once it’s successfully loaded.
var map;
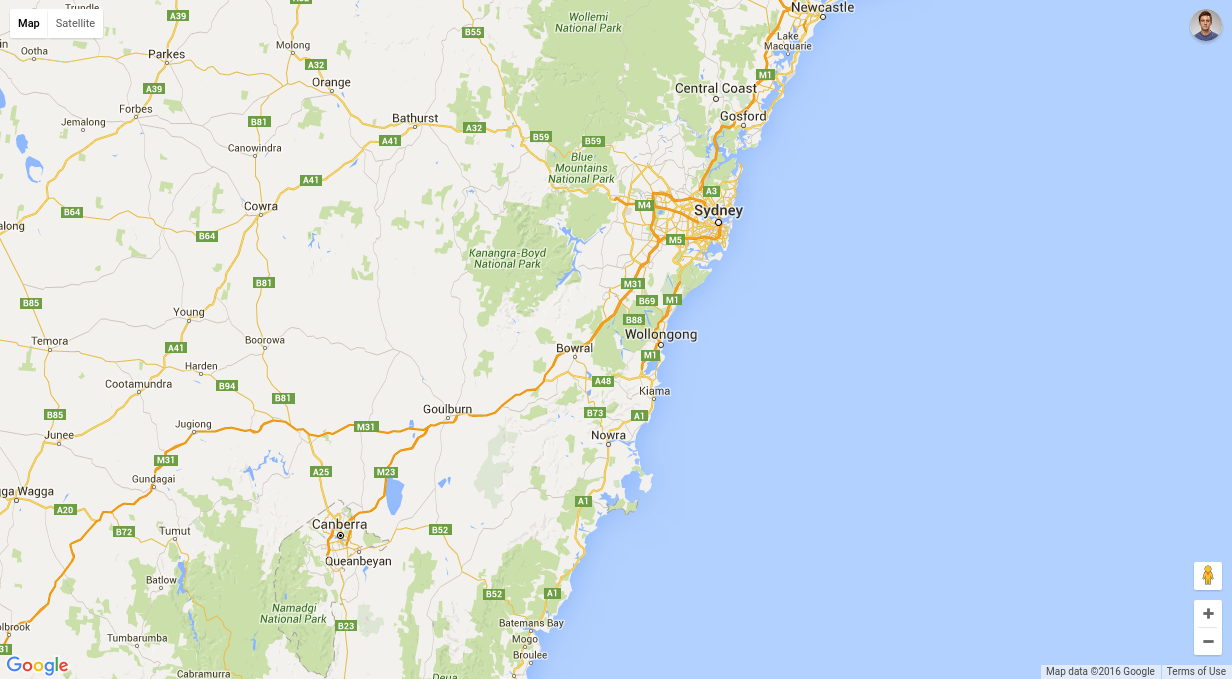
function initMap() {
map = new google.maps.Map(document.getElementById('map'), {
center: {lat: -34.397, lng: 150.644},
zoom: 8
});
}
When creating a new Google Map, it’s best to create the variable for the map in the global scope (outside of any functions) so that it’s easier to interact with the map later. This is why we define map outside of initMap().
Now that we’ve got an empty map variable to work with, we can go ahead and assign the Google Map object to it inside the initMap function. This is exactly as Google’s Simple Map example. One important thing to note is that we must specify both a center and a zoom, or the map will not initialize at all. There is no default!
Don’t forget the CSS
One last important step to getting the initial basic map canvas to function is to provide some CSS in our style.css file:
html, body {
  height: 100%;
  margin: 0;
  padding: 0;
}

#map {
  height: 100%;
}
The most common pitfall we’ll cover today is forgetting to set a height attribute for the #canvas element. Regardless of everything else covered in this article, if there’s no height (or min-height) CSS attribute set, we won’t see a map at all. The styles applied to <html> and <body> are only there to allow the canvas to be full-screen.
Adding Markers to the Map Canvas
Once we’ve got a basic map canvas displayed, the most common next task is to plot markers on the map. One piece of advice I always give in most programming contexts is to separate data from logic whenever possible. In this case this is illustrated by storing your marker details in a separate JSON file.
Create a JSON file for the markers
Go ahead and create a JSON file called markers.json:
[
  {
    "lat": 53.817680,
    "lng": -1.537657
  },
  {
    "lat": 53.790123,
    "lng": -1.53243
  },
  {
    "lat": 53.756745,
    "lng": -1.5309087
  },
  {
    "lat": 53.6474675,
    "lng": -1.49564554
  },
  {
    "lat": 53.69123456,
    "lng": -1.6545466
  }
]
It’s always a good idea to store Google Maps markers as latitude and longitude values rather than addresses. Otherwise, we have to use Google’s Geocoding service at runtime. This is a separate API with strict usage limits that will also add another external entity to the map initialization process, increasing latency.
Now that our JSON file is set up, we need to make use of it when initializing our map.
Plot the markers
Start off by amending the initMap() function to grab the markers.json file after the map has been initialized, using the shiny new Fetch API, passing a callback to a new function, plotMarkers(). We also use promises here to ensure the response is parsed into JSON before being passed to the callback function:
fetch('markers.json')
  .then(function(response){return response.json()})
  .then(plotMarkers);
Then let’s go ahead and define plotMarkers():
var markers;
var bounds;

function plotMarkers(m)
{
  markers = [];
  bounds = new google.maps.LatLngBounds();

  m.forEach(function (marker) {
    var position = new google.maps.LatLng(marker.lat, marker.lng);

    markers.push(
      new google.maps.Marker({
        position: position,
        map: map,
        animation: google.maps.Animation.DROP
      })
    );

    bounds.extend(position);
  });

  map.fitBounds(bounds);
}
As with our map variable, we want to define some more variables outside of the function, in the global scope. In this function, we’ll be working with markers and bounds, both of which may be useful elsewhere later, so it’s a good idea to have these in the global scope.
Inside the plotMarkers function, the first things we need to do are set our markers variable to an empty array, and set our bounds variable to an empty Google LatLngBounds object. We’ll use the LatLngBounds object to keep track of the area that needs to be viewable on our canvas to fit all of our markers on.
Now we need to iterate over each marker, providing an anonymous callback function which creates a new Google position object from the lat and lng parameters available in our JSON file. Once we’ve got that, we’ll create a new Google map marker object and push it into our markers array. Finally, we’ll extend our bounds using the new position:
var position = new google.maps.LatLng(this.lat, this.lng);

markers.push(
  new google.maps.Marker({
    position: position,
    map: map,
    animation: google.maps.Animation.DROP
  })
);

bounds.extend(position);
One thing to note: when creating a new Google map marker object, the only required parameters are position and map. The position parameter can be either an object containing lat and lng parameters, or a Google position object (as shown here). The map parameter is simply the Google map object that we want to plot the marker on. We also provide an animation parameter: this isn’t required, but is so easy to implement — and everyone loves a little animation!
Re-center the map canvas
Now that we’ve iterated through all of our markers, added them to the map and built our canvas bounds, we’ll call map.fitBounds() to re-center the map canvas around the markers plotted, overriding the initial center and zoom parameters we provided when initializing the map object. This is very useful, as it allows us to update our markers.json file without worrying about our center or zoom parameters.
See the Pen Google Maps JS API example by SitePoint (@SitePoint) on CodePen.
Closing Remarks
We should now have a working app that can display a full-screen Google Maps canvas, and plot markers on that map from a JSON file.
If you’re interested in taking it further, the next logical step would be to implement InfoWindows, which appear when a marker is clicked.
If you’re interested in building on the functionality already provided in this article, a good starting point would be to look at customizing the icons plotted on the map. This can be done by simply passing a URL as the icon parameter to the new marker object.
If you have any other improvements or suggestions, please feel free to add them in the comments.
And don’t forget, the full source code is available via our GitHub repo.