Build a Dynamic 3D Map with WRLD 3D

This article was sponsored by WRLD 3D. Thank you for supporting the partners who make SitePoint possible.
The following takes place between 7:00am and 8:00am, on Christmas Eve. Events occur in real time.
For all our data-gathering capabilities, we’re still hopeless when it comes to visualising that data in the 3D world we live in. We stare at 2D charts and log entries, but much of the data we pluck out of the world has meaning in a 3D context. And, it can be useful to visualise this data when it is applied back into a 3D model.
This is the problem Augmented Reality seeks to solve. In contrast to the fictional environments of Virtual Reality, Augmented Reality can help us solve many real problems; by applying the data we would otherwise consume through a 2D medium to the real world around us. Mapping is the first-born amongst Augmented Reality’s children.
When WRLD approached us, to write about their platform, I was immediately taken by their platform’s graphics and performance. Yet, the more I use their platform; the more I am fascinated by the usefulness of their API and fidelity of their mapping data.
We’re going to publish a series of tutorials, which demonstrate how to use this platform to bring information into the world it applies to. Each tutorial is themed according to a popular T.V. show. As you may have guessed, this first one is about 24.
In this tutorial, we’re going to learn how to get started with the WRLD platform. We’ll follow the documentation examples to render the simplest map. Then, we’ll create a local environment for compiling our code; and start to tell a story with it.
We’ll cover these topics:
- Rendering maps based on the name of a place
- Moving through a map, for a sequence of events
- Highlighting buildings and designing events at each building
- Playing sound files with the HTML5 Audio API
- Changing weather conditions and time of day for the map
The code for this tutorial can be found on Github. It has been tested with a modern versions or Firefox, Node, and macOS.
Getting Started
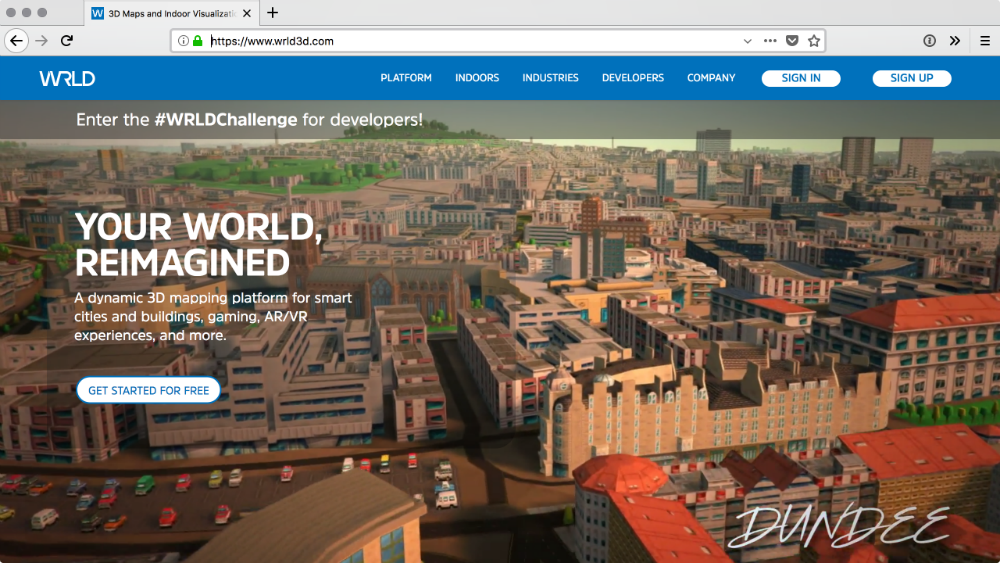
The easiest way to get started is to follow the first example, in the documentation. Before we can do that, we need an account. Head over to https://www.wrld3d.com and click “Sign Up”.
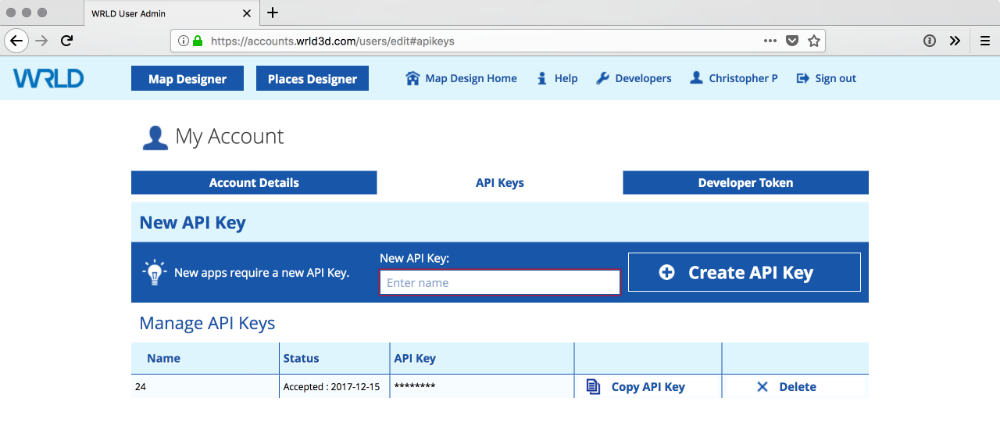
Once you’re logged in, click “developers” and “Access API Keys”.
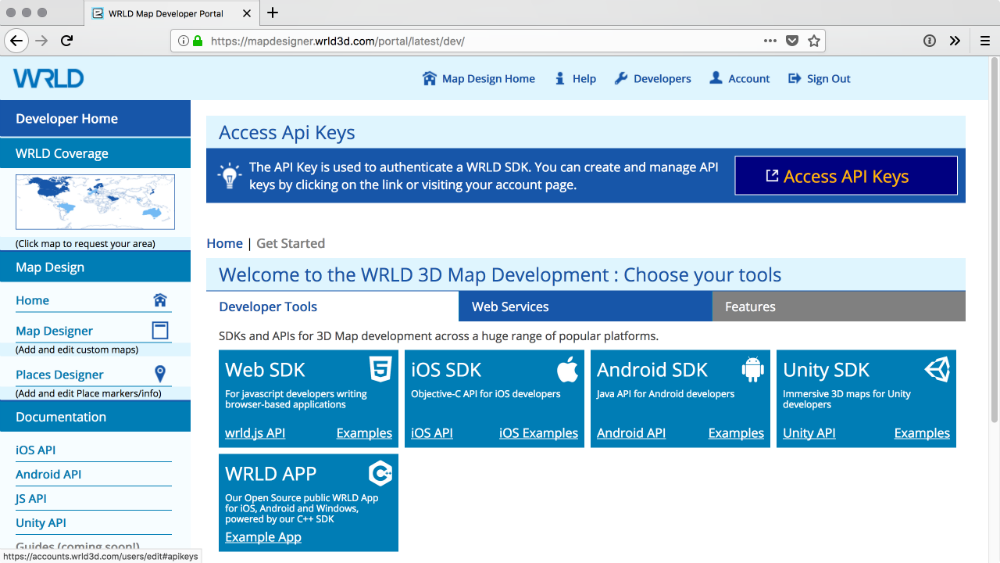
Create a new API key for your application. You can call it anything, but you’ll need to copy the generated key later…
We can get the code, for the first example, from the official documentation site. I’ve put it in CodePen, and replaced the coordinates with those for New York:
WRLD.js is based on Leaflet.js, which makes it familiar to anyone who has done a bit of map-based work before. It also means the maps are mobile-friendly and interactive.
Click and drag, with the left mouse button, to pan around the map. Click and drag, with the right mouse button, to rotate the map. Click and drag, with the middle mouse button to change the perspective angle. Scrolling the mouse wheel will affect the zoom. The map can also be controlled on touch devices.
Apart from including the Javascript SDK and stylesheet; we only needed about 5 lines of formatted code to render a sweet map of New York! The first parameter, map, is the ID of the element into which WRLD should render the map. The second is the API key we generated. The third is a configuration object. This object contains the coordinates for the centre of the map, and an optional zoom level.
Setting up a Build Chain
CodePen is great for a quick demo; but we need something more robust and presentable. Let’s set up something simple, that will compile all our modern Javascript into a version most browsers can understand.
ParcelJS was recently announced; as a fast, zero-configuration web bundler. Let’s put that to the test. Firstly, we need to install Parcel as a global application, through NPM:
npm install -g parcel-bundler
Next, we can create a handful of files for our project. We’ll need a Javascript file, a CSS file, and an HTML entry-point file:
const Wrld = require("wrld.js")

const map = Wrld.map("map", "[your API key here]", {
    center: [40.73061, -73.935242],
    zoom: 16,
})
This is from
tutorial/app.js
@import "https://cdnjs.cloudflare.com/ajax/libs/leaflet/1.0.1/leaflet.css";

html,
body {
    margin: 0;
    padding: 0;
    width: 100%;
    height: 100%;
}

#map {
    width: 100%;
    height: 100%;
    background-color: #000000;
}
This is from
tutorial/app.css
<!doctype html>
<html lang="en">
    <head>
        <meta charset="utf-8" />
        <link rel="stylesheet" href="./app.css" />
        <title>Getting started with WRLD</title>
    </head>
    <body>
        <div id="map"></div>
        <script src="./app.js"></script>
    </body>
</html>
This is from
tutorial/index.html
Notice how app.js is requiring wrld.js? We need to install the WRLD Javascript SDK:
npm init -y
npm install --save wrld.js
Then, we can start to build and run the local files using Parcel:
parcel index.html
This starts a local development server, and bundles the JS and CSS files. The process looks something like this:
Open up the URL is shows in a browser, and you should once again see the map of New York. As we make changes to the JS and CSS files, these will automatically be recompiled and reloaded in the browser. Parcel certainly seems to live up to its claims.
And, that’s exactly what we need – a low-effort build chain that will let us focus on getting stuff done with WRLD!
Parcel is still quite new. You may have difficulty with highly customised workflows or build requirements; and the documentation still has a ways to go to explain what to do in those situations. Still, I think this simple build chain will suit our needs, and Parcel has delivered on its promise here.
Converting Names to Coordinates
Sometimes we know the exact coordinates of the place we’re thinking of. Sometimes we only know the name of the place. Let’s quickly sidetrack, and look at how to work discover the coordinates of the place when we only know its name.
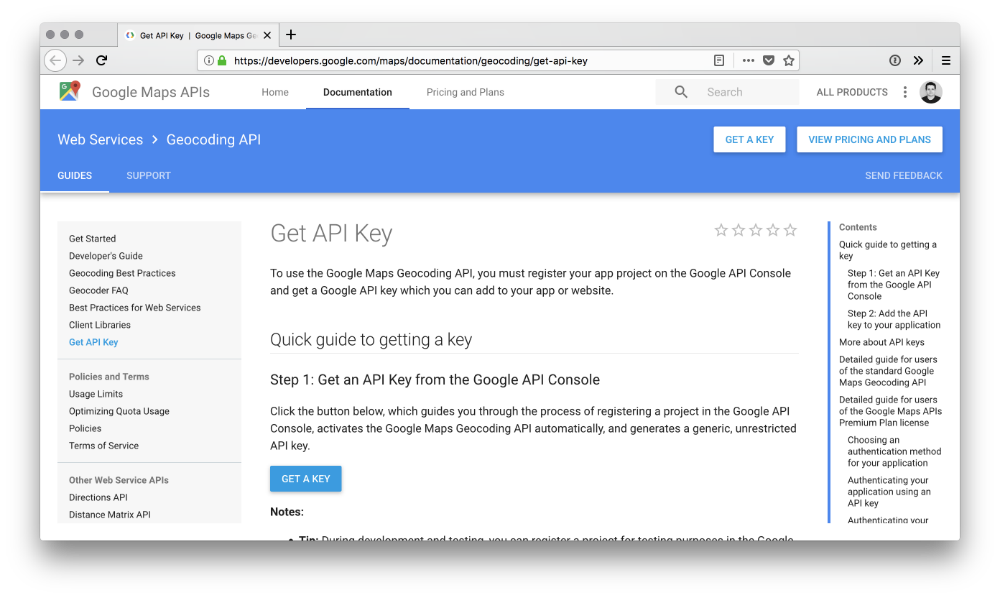
This is one of the few services not yet available on the WRLD platform. So, let’s use a Google API to work it out. We’ll need another API key, so head over to https://developers.google.com/maps/documentation/geocoding/get-api-key and click “Get a key”:
Next, we can use the Google Geocoding service to look up the coordinates for an address, by altering our Javascript a bit:
const Wrld = require("wrld.js")

const keys = {
    wrld: "[your WRLD API key]",
    google: "[your Google API key]",
}

window.addEventListener("load", async () => {
    const address = encodeURIComponent("empire state building, new york")

    const endpoint = "https://maps.googleapis.com/maps/api/geocode/json?"
        + "key=" + keys.google + "&address=" + address

    // console.log(endpoint)

    const response = await fetch(endpoint)
    const lookup = await response.json()

    // console.log(lookup)

    const { lat, lng } = lookup.results[0].geometry.location

    const map = Wrld.map("map", keys.wrld, {
        center: [lat, lng],
        zoom: 12,
    })
})
This is from
tutorial/app.js
I’ve refactored the keys into an object. We could even move these to an environment variables file, and exclude that file from Git. That way the keys could be useful but hidden to the public. I’ve also moved my code into an async short arrow function, so that I can use async and await; and so that it happens once the document is loaded.
Next, we can define an address to look up. It’s best to encode the address so that it can be used as a query string parameter. We can feed this into the geocoding API endpoint, along with the Google API key, to get a result.
Go ahead and uncomment the console log statements, so you can see what the encoded URI looks like, and what the result Google gives back to us looks like. We get quite a detailed result from Google, but the bits we want are inside results[0].geometry.location. Using object destructuring, we can extract just the lat and lng keys of that object.
Finally, we can feed those into the map function, and the map will render the Empire State Building. As I said, we’ll often know the coordinates for the centre of the map already. But, when we don’t: this service and code will help us to find them out.
Moving Through a Map
Let’s start working on our immersive map experience. We want to take someone through a series of events, and move the map to each new event, so we can tell them a story. A good way to separate the story content from the story mechanics is to create a separate “data” Javascript import:
module.exports = [
    {
        // start at Empire State Building
        lat: 40.7484405,
        lng: -73.98566439999999,
        seconds: 15,
        image: ".jack-1",
        text: "What a lovely day...<phone rings>",
    },
    {
        // stay in the same place but update story
        lat: 40.7484405,
        lng: -73.98566439999999,
        seconds: 15,
        image: ".chloe-1",
        text: "Jack, we have a problem...",
    },
    // ...more events
]
This is from
tutorial/story.js
We can divide the story up into map events. Each even has a lat and lng, though some events may happen at a previous location. For each event, we’ll show a picture of someone speaking, as well as what they’re saying. After a few seconds, we’ll move the camera to a new location and/or speaker.
We can import this file into our main Javascript file, and change the map to show the first story event. We can even highlight the building in which the event is taking place:
const story = require("./story")

window.addEventListener("load", async () => {
    // ...old code commented out here

    const { lat, lng } = story[0]

    const map = Wrld.map("map", keys.wrld, {
        center: [lat, lng],
        zoom: 15,
    })

    map.on("initialstreamingcomplete", () => {
        Wrld.buildings
            .buildingHighlight(
                Wrld.buildings
                    .buildingHighlightOptions()
                    .highlightBuildingAtLocation([lat, lng])
                    .color([125, 255, 125, 128]),
            )
            .addTo(map)
    })
})
This is from
tutorial/app.js
This code demonstrates how to highlight a building, once the initial map rendering/streaming is complete. Wrld.buildings.buildingHighlightOptions creates a template options object, to which we add the location and colour of the highlight. We pass this options object to Wrld.buildings.buildingHighlight to create the highlight, and add it to the map. The color array is an RGBA value, which means the fourth integer is an opacity value (128 is about half of the 255 limit, or 50% transparent).
This isn’t the only way to highlight buildings. We could also use ray casting to select a building, but that’s a but more advanced than what we need here. You can find documentation for it, at https://wrld3d.com/wrld.js/latest/docs/api/L.Wrld.buildings.BuildingHighlightOptions
In fact, while we’re at it; we can abstract this building highlights into a reusable function. We can even add specific highlight colors for each event, and remove previous building highlights each time we add a new one:
const { lat, lng, color } = story[0]

const map = Wrld.map("map", keys.wrld, {
    center: [lat, lng],
    zoom: 15,
})

map.on("initialstreamingcomplete", () => {
    highlightBuildingAt(lat, lng, color)
})

let highlight = null

const highlightBuildingAt = (lat, lng, color) => {
    if (highlight) {
        highlight.remove()
    }

    highlight = Wrld.buildings
        .buildingHighlight(
            Wrld.buildings
                .buildingHighlightOptions()
                .highlightBuildingAtLocation([lat, lng])
                .color(color),
        )
        .addTo(map)
}
This is from
tutorial/app.js
This way, Jack and Chloe can have their own highlight colors, to show when they’re speaking. Removing building highlights is even easier than adding them. We just need to save a reference to the highlight we created, and call the remove method on it.
Moving the Map
Ok, now we need to move the map to each new event. We’ll highlight the building for each event, so we know which one we’re looking at:
const { lat, lng, zoom, color, seconds } = story[0]

const map = Wrld.map("map", keys.wrld, {
    center: [lat, lng],
    zoom,
})

map.on("initialstreamingcomplete", () => {
    highlightBuildingAt(lat, lng, color)

    if (story.length > 1) {
        setTimeout(() => showNextEvent(1), seconds * 1000)
    }
})

let highlight = null

const highlightBuildingAt = (lat, lng, color) => {
    if (highlight) {
        highlight.remove()
    }

    highlight = Wrld.buildings
        .buildingHighlight(
            Wrld.buildings
                .buildingHighlightOptions()
                .highlightBuildingAtLocation([lat, lng])
                .color(color),
        )
        .addTo(map)
}

const showNextEvent = index => {
    const { lat, lng, zoom, degrees, color, seconds } = story[index]

    map.setView([lat, lng], zoom, {
        headingDegrees: degrees,
        animate: true,
        durationSeconds: 2.5,
    })

    setTimeout(() => {
        highlightBuildingAt(lat, lng, color)

        if (story.length > index + 1) {
            setTimeout(() => showNextEvent(index + 1), seconds * 1000)
        }
    }, 2.5 * 1000)
}
This is from
tutorial/app.js
There’s a lot going on here, so let’s break it down:
- We’ve added a
zoomproperty to each event. This means we can animate the level of zoom between events, which adds a lot of dynamism to the story. We’ve also added adegreesproperty, to all but the first event. We could modify the first event’s camera heading, but I’m fine with how it looks by default (360 degrees). Adding degrees to events allows us to animate the heading in much the same way as the zoom. - If there are multiple events (it’s safe to assume this but I’ve added the check anyway) then we use the
secondsproperty of the first event to delay the transition to event #2. We create ashowNextEventfunction, with a hard-coded index value of1. - In
showNextEvent, we use thesetViewmethod to animate the position, zoom, and heading of the camera. The animations will take2.5seconds, so we set a timeout for that long. In the timeout callback function, we highlight the new building (so that the highlight only happens after the camera is done moving) and queue up the next event.
Feel free to add more events and/or change the story entirely. Make it your own, and have fun!
Adding Audio
Our story is a little quiet. We need some suspenseful background music to put us in the zone. Head over to a site like Epidemic Sound and find some suspenseful music tracks, for your story. I’ve downloaded a few, and put them in a tutorial/tracks folder.
Now, let’s create an invisible audio player, and have it play tracks at random. For that to work, we need a list of tracks:
<!doctype html>
<html lang="en">
    <head>
        <meta charset="utf-8" />
        <link rel="stylesheet" href="./app.css" />
        <title>Getting started with WRLD</title>
    </head>
    <body>
        <div id="map"></div>
        <audio class="track-1" src="./tracks/track-1.mp3" />
        <audio class="track-2" src="./tracks/track-2.mp3" />
        <audio class="track-3" src="./tracks/track-3.mp3" />
        <audio class="track-4" src="./tracks/track-4.mp3" />
        <audio class="track-5" src="./tracks/track-5.mp3" />
        <audio class="track-6" src="./tracks/track-6.mp3" />
        <audio class="track-7" src="./tracks/track-7.mp3" />
        <audio class="track-8" src="./tracks/track-8.mp3" />
        <audio class="track-9" src="./tracks/track-9.mp3" />
        <audio class="track-10" src="./tracks/track-10.mp3" />
        <script src="./app.js"></script>
    </body>
</html>
This is from
tutorial/index.html
Parcel is watching index.html and rewrites all static file references to files it copies into the dist folder. If we create the HTML4 audio tags in this HTML file, Parcel will copy those files to the list folder, and serve them through the development server. We don’t have to do things this way, but it’s simpler for testing as we develop.
One alternative would be to reference these files from somewhere on the internet. Another would be to not use the development server.
module.exports = [
    ".track-1",
    ".track-2",
    ".track-3",
    ".track-4",
    ".track-5",
    ".track-6",
    ".track-7",
    ".track-8",
    ".track-9",
    ".track-10",
]
This is from
tutorial/tracks.js
We can use this list to find the HTML elements, linked to each *.mp3 file we want to play. We’re just about to use this list in our main JS file:
const nextTrack = () => {
    const index = Math.floor(Math.random() * tracks.length)

    const audio = new Audio(document.querySelector(tracks[index]).src)
    audio.addEventListener("ended", () => nextTrack())
    audio.play()
}

nextTrack()
This is from
tutorial/app.js
We want to play a track at random, so we find a random index. Then, we fetch the audio element matching that index and create a new Audio object with its src attribute value. When the track has finished playing, we call the nextTrack function again (so the next random track starts playing, in a loop) and start the randomly chosen track.
Unfortunately, I can’t include the tracks I’m using in the Github repository. Firstly, they would grow the size of the repo immensely. Secondly, I have the rights to use them for YouTube productions but not to distribute them for any other reason. If you want to get the tracks I’ve used, you can find them on this Epidemic Sound search results page.
Adding Info Cards for Events
I mentioned before; WRLD.js is based on LeafletJS. This is great because we can do everything Leaflet allows us to, while working with WRLD maps. In fact, we can use Leaflet popups to narrate story events. A Leaflet popup looks like this:
L.popup()
    .setLatLng(latlng)
    .setContent("I am a popup!")
    .openOn(map)
We’re going to embed each event’s image and text in the popup. It would also be cool if we could position the popup in relation to the elevation of the building. Not right at the top, but…say…half way up the building. We could use something like this:
let popup = null

const showPopup = (lat, lng, image, text, elevation) => {
    const src = document.querySelector(image).src

    const element1 = "<img class='image' src='" + src + "' />"
    const element2 = "<span class='text'>" + text + "</span>"
    const element3 = "<div class='popup'>" + element1 + element2 + "</div>"

    popup = L.popup({
        closeButton: false,
        autoPanPaddingTopLeft: 100,
        elevation: Math.max(20, elevation / 2),
    })
        .setLatLng(L.latLng(lat, lng))
        .setContent(element3)
        .openOn(map)
}
This is from
tutorial/app.js
L.popup accepts an options object. The options we’re setting are:
- We want to hide the close button that usually shows on Leaflet popups.
- We want the camera to allow enough space between the top/left of the screen, when the camera is finished panning to show the popup.
- We want the popup to be at least 20 meters from the ground floor and at most half the other elevation of the building.
We’re also constructing an HTML string; which places the event’s image and text inside a .popup element. We can use the following styles for these elements:
.hidden {
    display: none;
}

.image {
    display: flex;
    width: auto;
    height: 100px;
}

.text {
    display: flex;
    padding-left: 10px;
    font-size: 16px;
}

.popup {
    display: flex;
    flex-direction: row;
    align-items: flex-start;
}
This is from
tutorial/app.css
.popup is a Flexbox container element. The flex styles we’re applying to it are that the children should be displayed in a row and that they should be aligned to the top of the container. There are many great Flexbox guides. Take a look at Flexbox Zombies for a fun way to learn…
Notice that we’re also defining the
.hiddenstyle, for the images inindex.html. We don’t want them to be displayed – they’re there so that Parcel will copy and reference them correctly.
The question is: how do we get the elevation of each building? We can listen for building information events, and work out the elevation from there. Unfortunately, there’s no per-highlight way to do this, so we’ll have to hook into “global” events and add/remove listeners sneakily:
let elevation = 0

const waitForElevation = onElevation => {
    const listener = event => {
        map.buildings.off("buildinginformationreceived", listener)

        const information = event.buildingHighlight.getBuildingInformation()

        if (!information) {
            onElevation(0)
        } else {
            const dimensions = information.getBuildingDimensions()
            const ground = dimensions.getBaseAltitude()
            const elevation = dimensions.getTopAltitude() - ground

            onElevation(elevation)
        }
    }

    map.buildings.on("buildinginformationreceived", listener)
}
This is from
tutorial/app.js
waitForElevation creates and adds a listener function to the buildinginformationreceived map event. The moment the listener is triggered, it removes itself. This way, we can trigger a per-highlight kind of event: add listener → building is highlighted → listener is invoked → listener is removed.
buildinginformationreceived receives an event, which has a getBuildingInformation method. If the building has any information, we get the ground altitude and work out the elevation from that. If not, we call the onElevation function parameter. So, onElevation gets called with an integer, 0 or greater.
All that’s left to do is add an onElevation callback to each highlightBuildingAt call; and call waitForElevation inside that function:
map.on("initialstreamingcomplete", () => {
    highlightBuildingAt(
        lat, lng, color,
        elevation => showPopup(lat, lng, image, text, elevation)
    )

    if (story.length > 1) {
        setTimeout(() => showNextEvent(1), seconds * 1000)
    }
})

let highlight = null

const highlightBuildingAt = (lat, lng, color, onElevation) => {
    waitForElevation(onElevation)

    // ...rest of highlightBuildingAt
}

const showNextEvent = index => {
    // ...rest of showNextEvent

    setTimeout(() => {
        highlightBuildingAt(
            lat, lng, color,
            elevation => showPopup(lat, lng, image, text, elevation)
        )

        if (story.length > index + 1) {
            setTimeout(() => showNextEvent(index + 1), seconds * 1000)
        }
    }, 2.5 * 1000)
}
This is from
tutorial/app.js
Changing Weather and Time of Day
Jack’s story plays out in winter; but the map is sunny and bright. Let’s change the weather to be a little more in keeping with the season:
map.themes.setWeather(Wrld.themes.weather.Snowy)
This is from
tutorial/app.js
It’s ridiculously easy to change the weather. Here, we’re making it snowy; but we could make it any of the following:
Wrld.themes.weather.ClearWrld.themes.weather.OvercastWrld.themes.weather.FoggyWrld.themes.weather.RainyWrld.themes.weather.Snowy
Similarly, we want to make the passage of time a little more realistic. Each 24 episode is supposed to happen over the course of 1 hour. It would be great if we could make each location be 1 hour apart, but we only have these times to work with:
Wrld.themes.time.DawnWrld.themes.time.DayWrld.themes.time.DuskWrld.themes.time.Night
Let’s change the time of day depending on each event:
const { lat, lng, zoom, color, seconds, image, text, time } = story[0]

const map = Wrld.map("map", keys.wrld, {
    center: [lat, lng],
    zoom,
})

if (time) {
    map.themes.setTime(time)
}

// ...later

const showNextEvent = index => {
    const {
        lat, lng, zoom, degrees, color, seconds, image, text, time
    } = story[index]

    map.setView(...)

    setTimeout(() => {
        if (time) {
            map.themes.setTime(time)
        }

        highlightBuildingAt(...)

        if (story.length > index + 1) {
            setTimeout(...)
        }
    }, 2.5 * 1000)
}
This is from
tutorial/app.js
Summary
We’re done for today. I hope you had as much fun, following along, as I did putting this together. Take some time to embellish your story; adding new characters, new music, and whatever bits you think will make your story great. We’d love to see what you come up with.
Here’s a video of the final product. I’ll be adding more events to this, but I’m super proud of what we managed:
Next time, we’re going to learn more about the presentation, animation, and automation the WRLD platform allows. In fact, we’re going to use WRLD to create a useful, saleable mobile friendly application. See you next time!