Canva Tutorial: Create a Slick Infographic in 15 Minutes

With a whopping 800% increase in search traffic for the word “infographic” between 2010-2012, it is no surprise that infographics are a hot ticket item in 2015. Online applications like Piktochart, Easel.ly and Canva are capitalizing on this infographic trend and making sharing information easier than before.
Not sure what Canva is exactly? Our short video, What is Canva? (below) will tell you everything you need to know. If it catches your attention, you should totally check out our brand new Canva course to learn more about it.
A few weeks ago everyone was talking about THAT infamous “dress”. For anyone who was away from Earth recently and that missed the biggest controversy of 2015, don’t panic! We’re going to put you “in the know” by creating an explanatory infographic in Canva.
That Dress and the Raw Numbers
Before we can start creating an infographic of any type we need to gather our data. The following statistics come from the good people at Facebook Data Science.
According to Facebook:
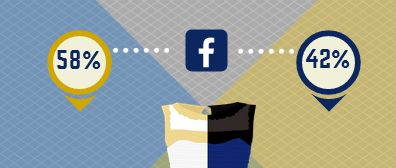
- 58% of Facebook users saw The Dress as white and gold
- 42% of Facebook users saw The Dress as black and blue
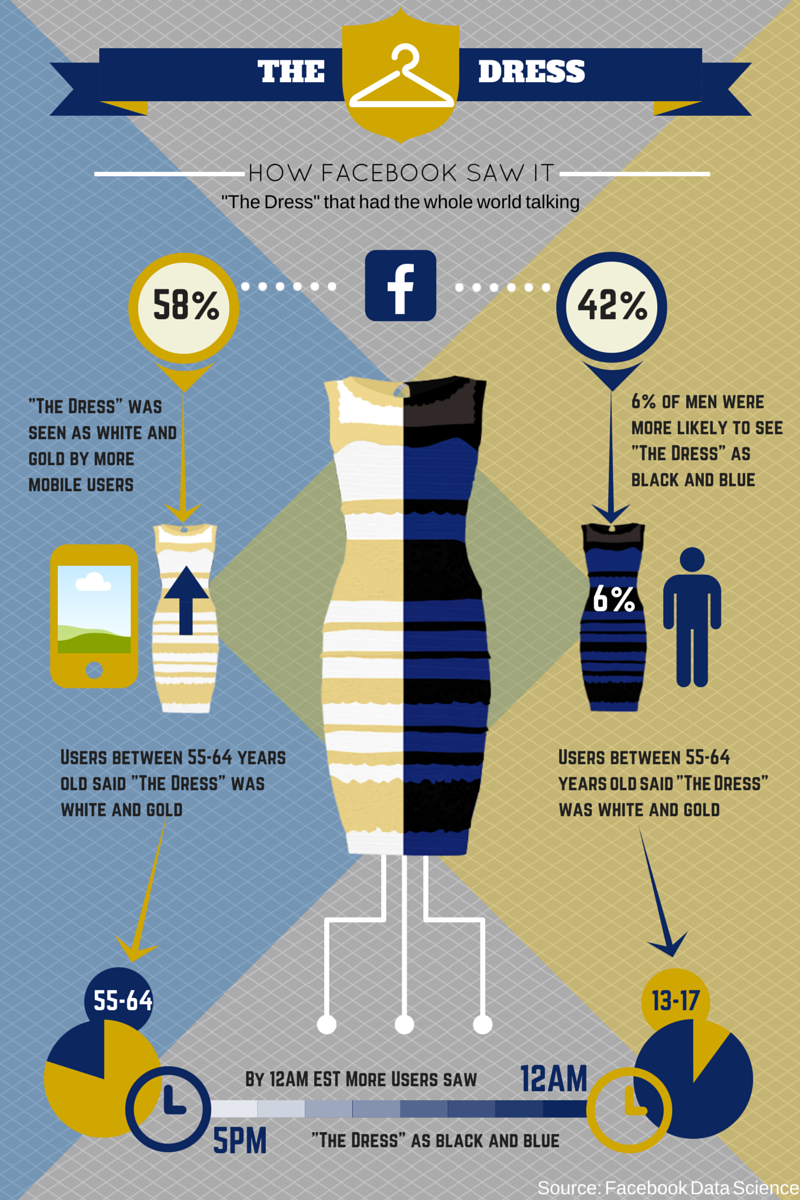
- Men were 6% more likely to see The Dress as black and blue
- More mobile users saw The Dress as white and gold
- Facebook users between the ages of 13-17 were more likely to declare The Dress as black and blue
- Facebook users between 55-64 were more likely to declare The Dress as white and gold
- By 12AM EST more users saw The Dress as black and blue as opposed to earlier in the day more than likely due to the dilemma being solved
Getting Started
For those who are not familiar with Canva, it is a free online web app that can be used to design all sorts of graphic design materials. From presentations to menus to social media headers, Canva makes designing a lot easier especially for non-designers.
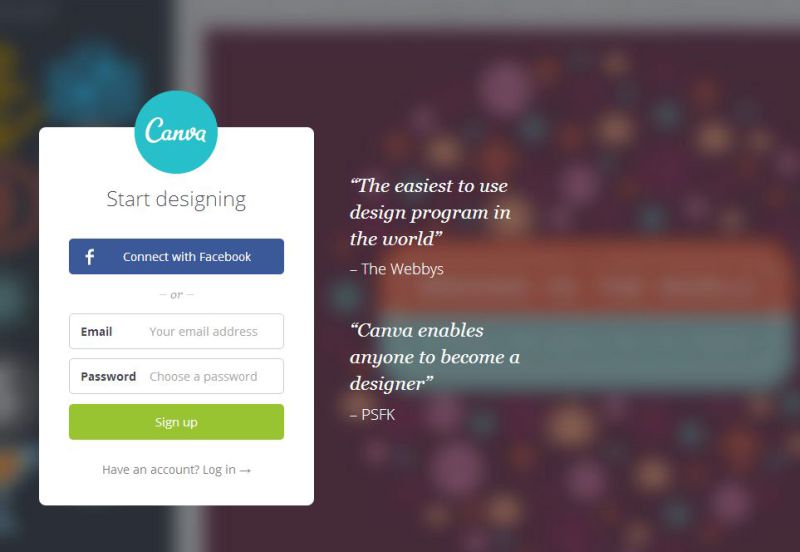
Signing up for Canva really takes only a minute. You have the choice of either logging in via your Facebook page or creating a quick account.
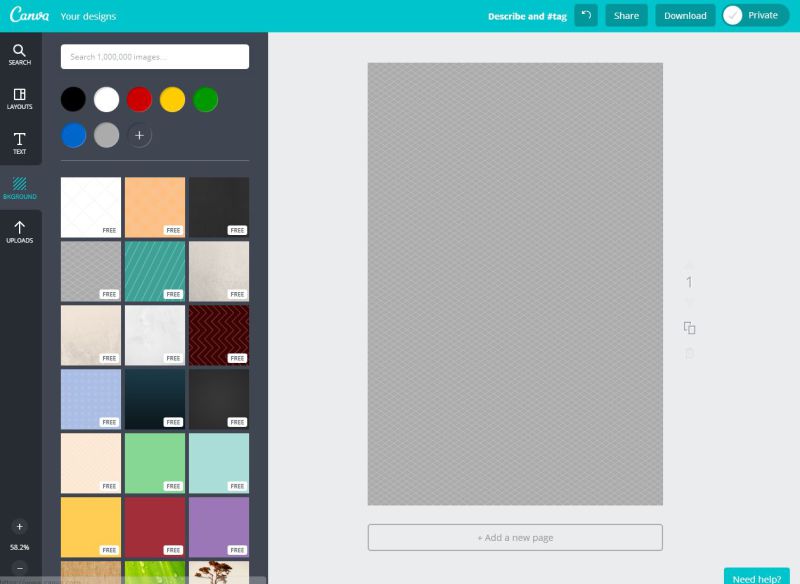
Once you have registered and activated your account through the e-mail you were sent you will be taken to the main dashboard. Here you can see some of the design formats you can create.
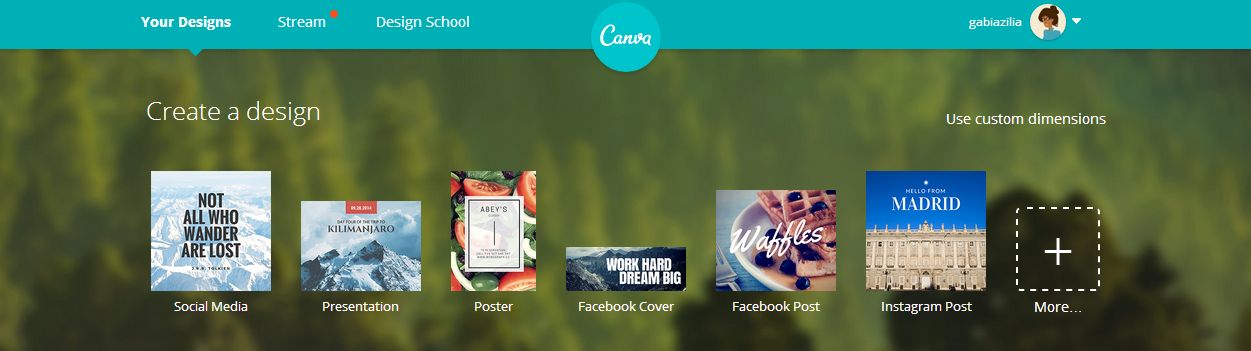
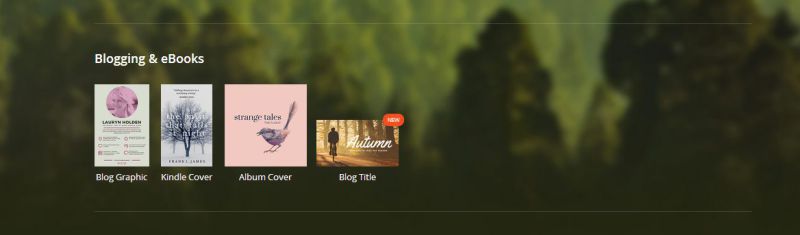
Because Canva as of right now doesn’t have a design template designated for creating infographics you’ll have to settle for the Blog Graphic template. Don’t worry though because this template is more than doable to create most infographics you need to make.
Designing in Your Dashboard
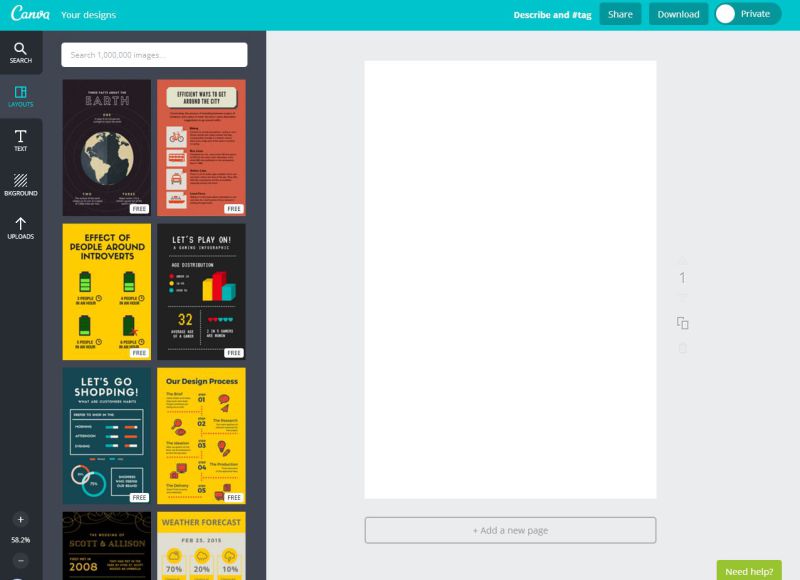
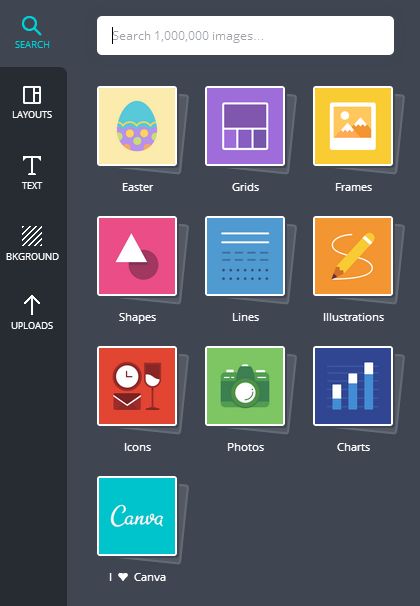
Unlike a lot of web apps, Canva doesn’t give you a pop-up walkthrough but everything is pretty self-explanatory. The dashboard, you will come to find out is very easy to navigate for all your designing needs. To the left you will find 5 tabs that offer various designing elements and customizations for you to work.
Search
The Search tab will be your go-to area for most of your design elements. You will find various sub-groups like lines, illustrations and photos which will typically make up the basis for your design.
Layouts
Depending on the template you choose after login you will find different pre-made layouts for you to use and build upon if you choose to use them.
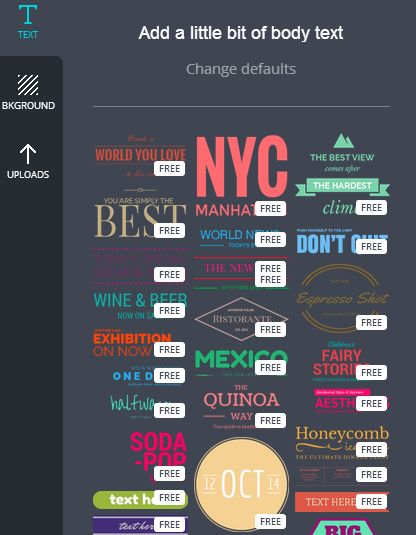
Text
Here beneath the Text tab you will find preloaded text options and layouts but can also customize how certain text formats will appear.
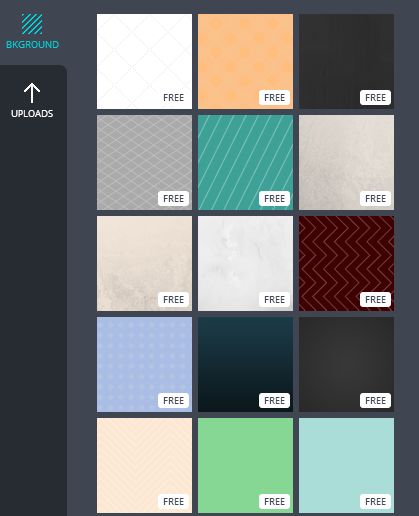
Background
With the Background tab you can very easily change the color of your canvas or add the textured or patterned backgrounds that are provided.
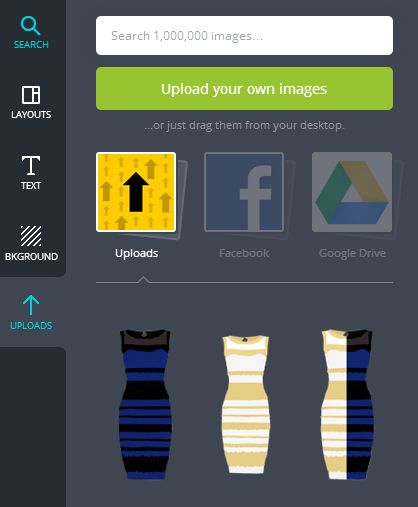
Uploads
The Uploads tabs allows you to upload your own resources from either your computer, Facebook or Google Drive if you find that Canva doesn’t have something you are looking for.
Setting Up Your Infographic
Now that you’ve gotten the layout of Canva it’s time to actually make our infographic. To get started we need to create our background by clicking on the Background tab. For this particular design I want to keep to a subtle look so that all the information is easily readable. The fourth background design will act as a nice backdrop and offer contrast between all the elements.
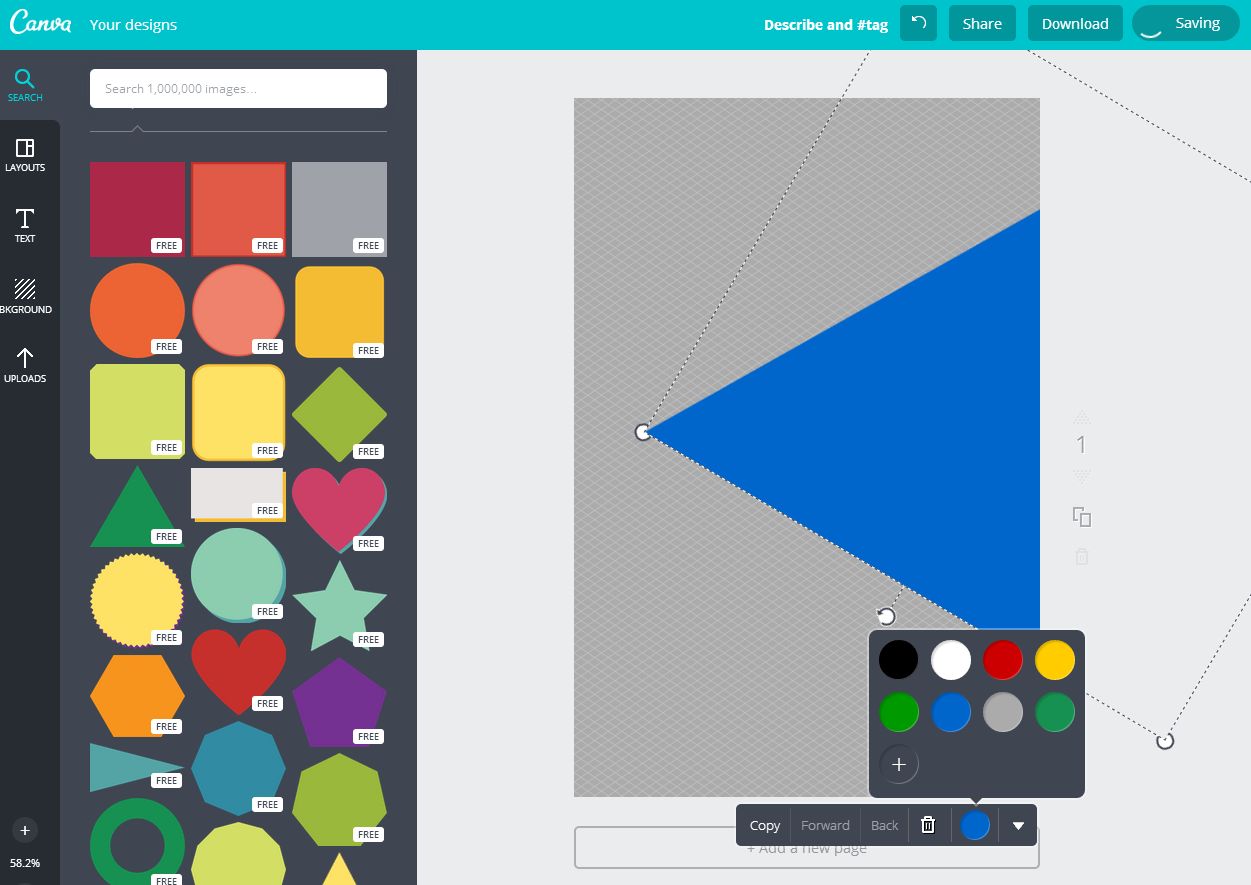
To add more contrast and interest to the background I’m going to add shapes. By clicking on the Search tab and the Shapes sub-group you can make your selections. For this design I am simply going to use triangles.
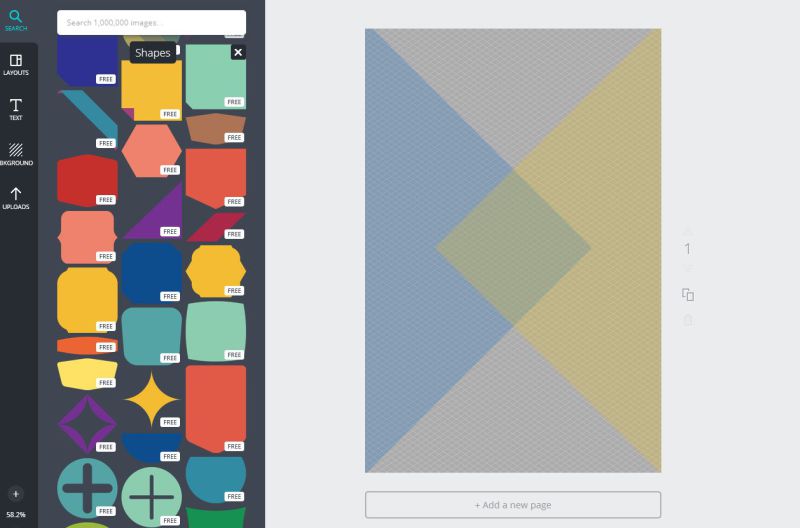
I’ll continue placing my shapes and modifying colors and transparencies until I get something I like. Here is what I have now.
Adding Elements
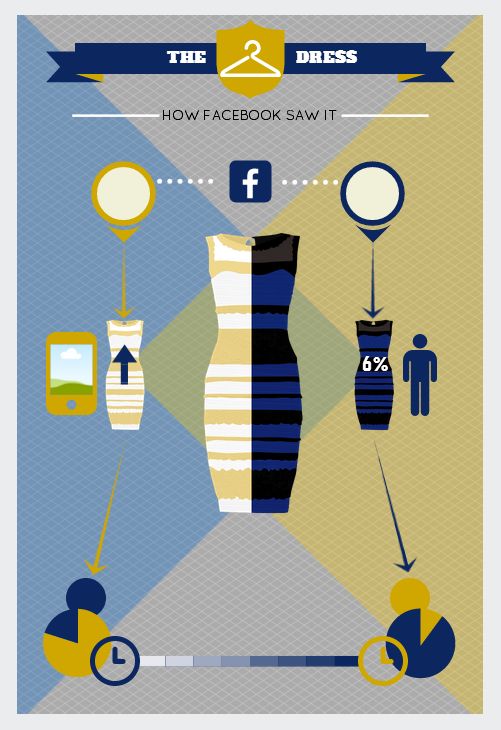
With the background done it is time to start fleshing the infographic out a bit more. We will start first by adding in the visual elements such as a title, sub-text and the key visual graphics. I have created various versions of the dress in both the black and blue form, the white and gold and of course a mashup of the two.
By placing these elements down first it allows me to get a better idea of how my infographic will eventually look before I start adding the important information to make the infographic a true infographic.
I’ve used the Text, Search (Icons) and Upload tabs in order to get these specific elements on my canvas.
Now by using elements in the Text and Search tabs I can start adding in the information from the statistics gathered earlier.
I’ll continue adding more elements to further flesh out my infographic to map out where my statistics will be placed.
Finishing Up
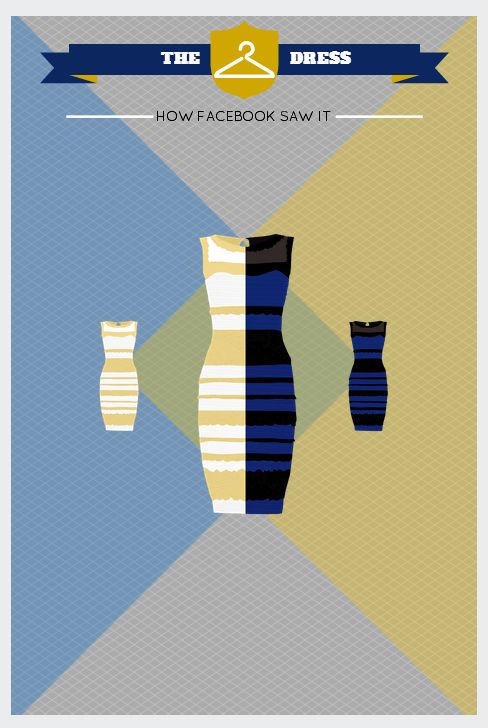
To finish up my infographic I tweaked a few things, added in the important text and a few more numbers to make my visuals make sense. Here is the final result:
Final Thoughts
Personally I really like Canva, particularly since this was the first time I’d used it. The interface is user-friendly, designing is pretty easy and best of all you don’t have to be a designer or artist in order to create something that looks pretty professional.
I would give it a solid 9 out of 10, only subtracting a mark for the fact that I found it a little tricky to grab the right element if it was too close to something else.
All in all Canva is an impressive program, especially considering it is free. Designing infographics or just doing quick and dirty mockups, no matter the project, can be done easily as long as you have your information on hand. I would definitely recommend the program for designers and non-designers alike.
Though it won’t fit every project, Canva may well deliver you a result faster than most options — and it won’t cost a cent to find out.