How to Build an Interactive History Map with WRLD

This article was created in partnership with WRLD. Thank you for supporting the partners who make SitePoint possible.
There’s nothing new about using maps in education—they engage students and help them visualize location-based information. With the rise of digital e-learning platforms, they remain an important resource. Today’s educators need a mapping tool that is attractive and intuitive, easy to customize, can be accessed online and on mobile devices, and makes sharing with students simple. And if the maps are 3D, so much the better.
I’ve just described WRLD. And while it’s great for developers, the company’s online Map Design tools (“a mapping tool for everyone”) open the door for those with absolutely no coding skills to create powerful custom maps.
WRLD invites anyone to design and manage custom 3D maps through our cloud-based mapping tool without extensive coding, optimized for both modern web and mobile applications.
Unlike Google Maps, WRLD is completely 3D. That will make anyone familiar with modern gaming feel completely at home. WRLD also prioritizes privacy, control and developer extensibility. It’s a product that ticks all the boxes. How would a teacher go about using it?
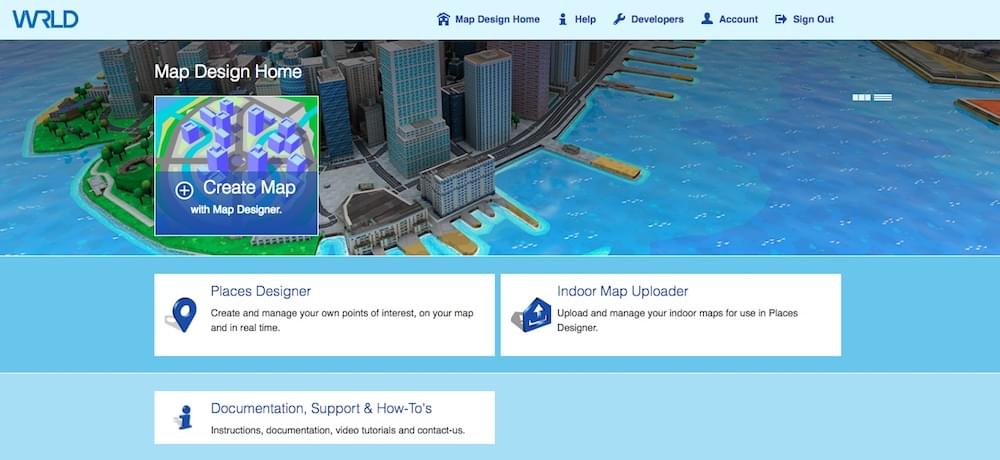
Create Custom 3D Maps with WRLD
Here’s the idea: WRLD provides you with a complete 3D map of the planet. You select the location you’re teaching about, select a suitable theme, add points of interest, and create cards that communicate your location-based content. You can then share a link of your map that opens a web browser or mobile app, embed it on a web page, or even include it in your own e-learning software.
Our goal is to build the most intelligent representation of the world in 3D.
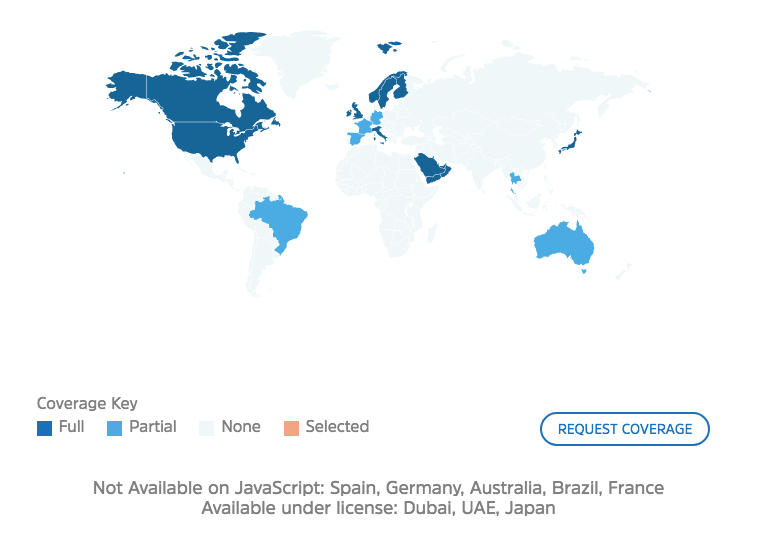
WRLD is a work in progress. Rendering the entire world in 3D is a huge task, and it doesn’t yet offer maps of every country (although users can vote for new areas to be included in WRLD). Features are still being added, and documentation is still being created. But despite those limitations, it’s a compelling mapping product that will already meet many of your needs.
Currently over 300 million square meters of maps are available. There is full coverage of the US, Canada, UK, Ireland, Scandinavia, the Arab Peninsula, Italy and more, as well as partial coverage of Spain, Australia and Thailand. That should cover a lot of your syllabus!
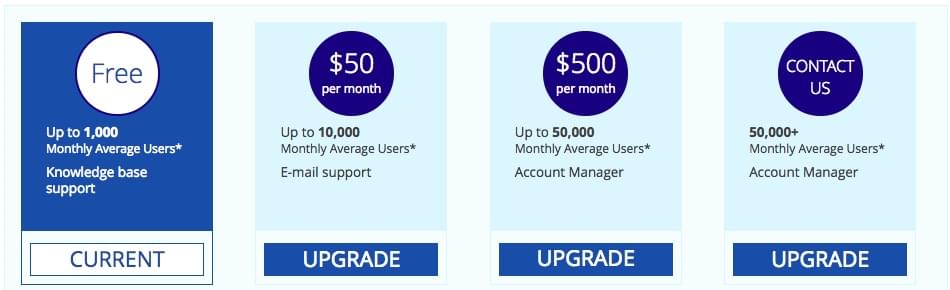
The cost should be quite attractive to most educators. WRLD is completely free if you have 1,000 monthly users or less, which will be most teachers and small training organizations. Larger educational institutions and e-learning platforms may need to pay a modest fee, as indicated in the screenshot below.
So how do you go about creating a 3D map for education? We’ll show you by creating a map about The Great Fire of London. You can view it in your web browser here, or explore the embed below.
Map Designer: Create a 3D Map Without Coding
Non-developers will use WRLD’s Map Designer, an online tool that is designed for both pros and beginners. Create and manage your own 3D maps, selecting simple or sophisticated styles.
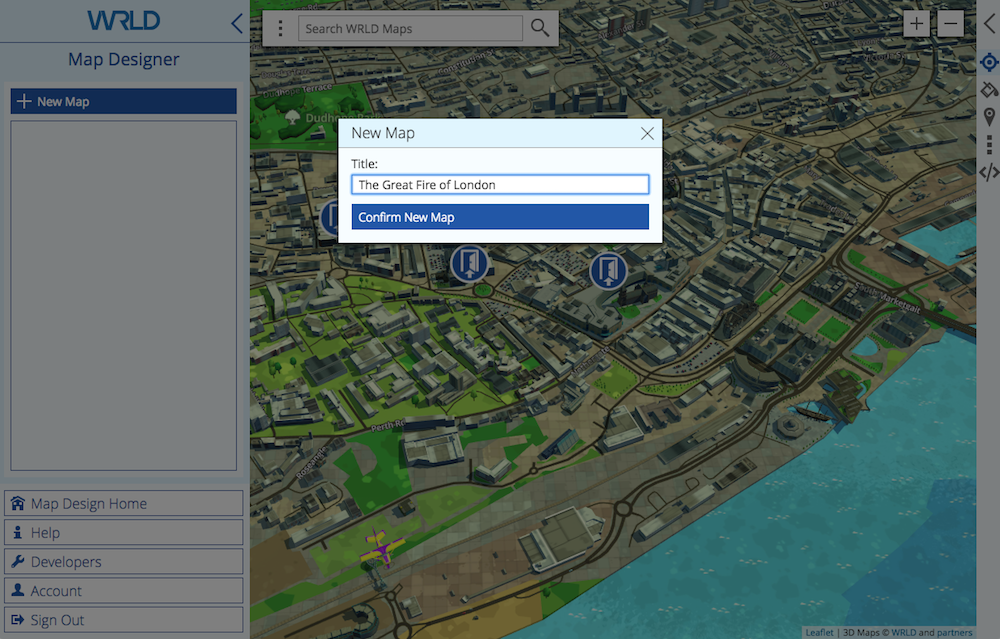
Once you create an account, you can create your first map. Give the map a name, and you’ll be given a URL. You may like to paste the address into a different browser tab so you can monitor your progress from your students’ point of view.
Navigating the map is intuitive. Left click and drag to move the map around, scroll to zoom in and out, and right click and drag to rotate. As you zoom in the display changes from 2D to 3D automatically.
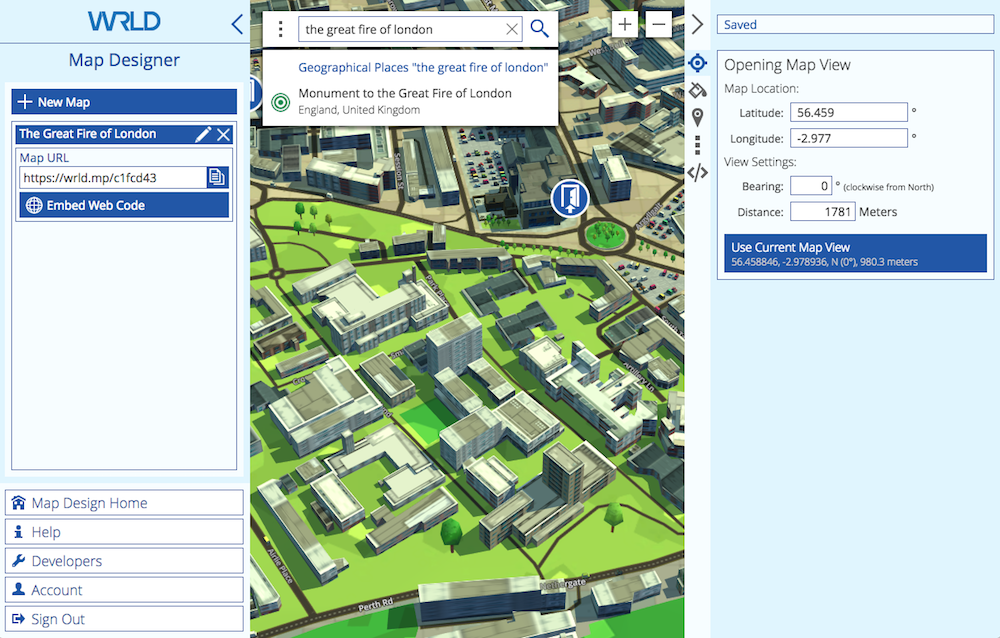
Our first job is to define the initial view that your students will see when they open the map. The Great Fire of London happened north of the Thames, adjacent to London Bridge. I start with a search for “the great fire of london” and discover that there is a monument at the site. That should get me close.
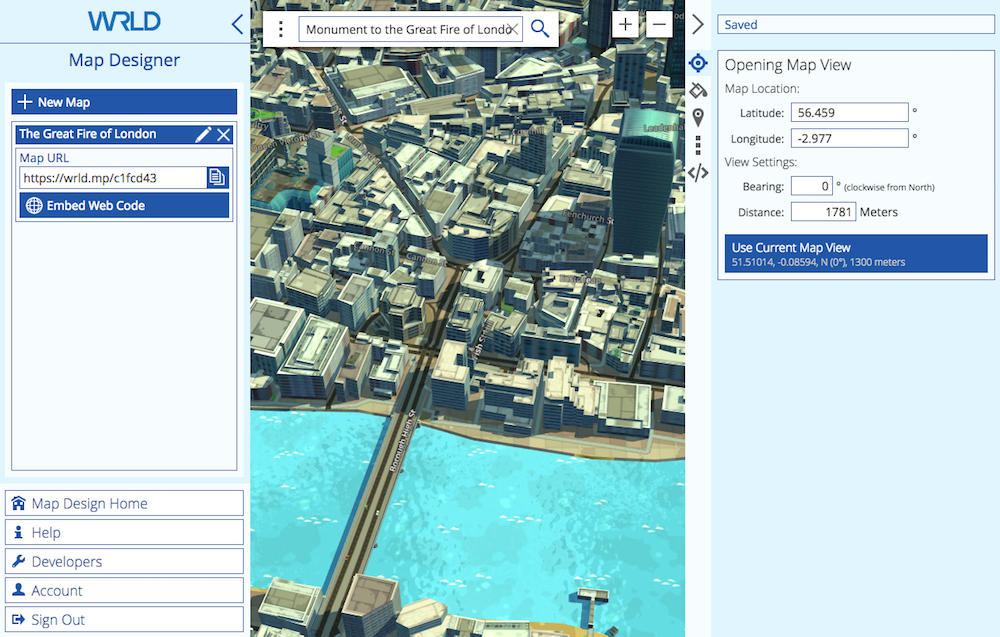
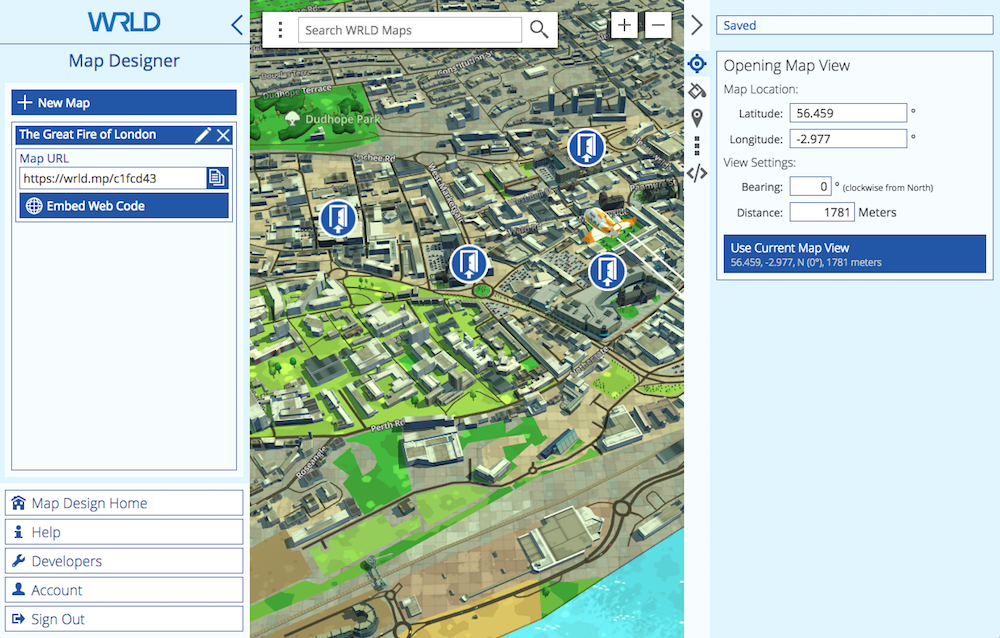
That’s perfect, and I’d like this to be what the map displays when it is opened. I click Use Current Map View in the right pane.
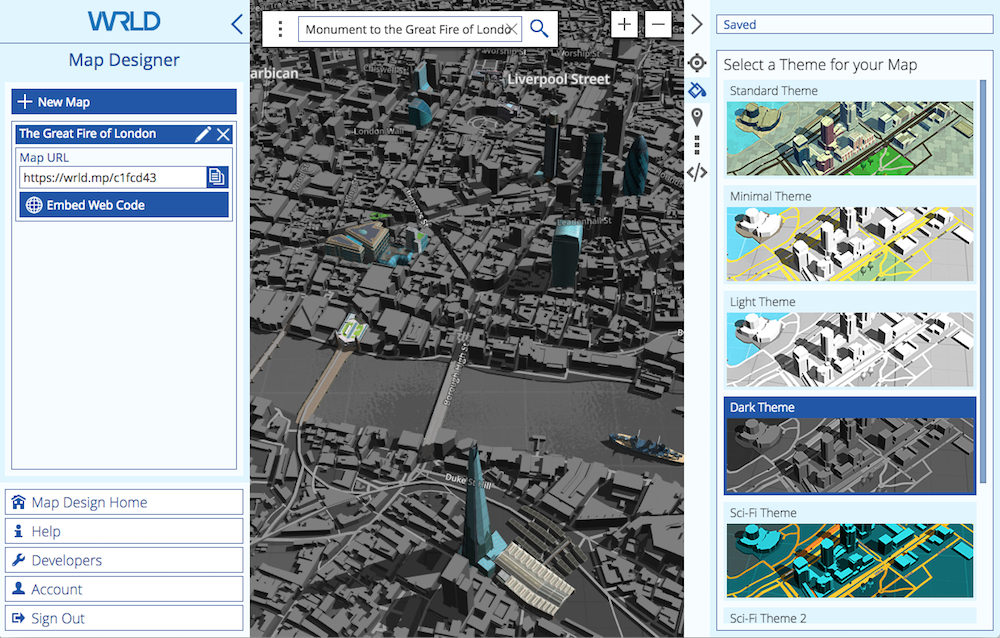
We now need to select a theme, so I click the paint can icon in the right pane. I like the look of the dark theme.
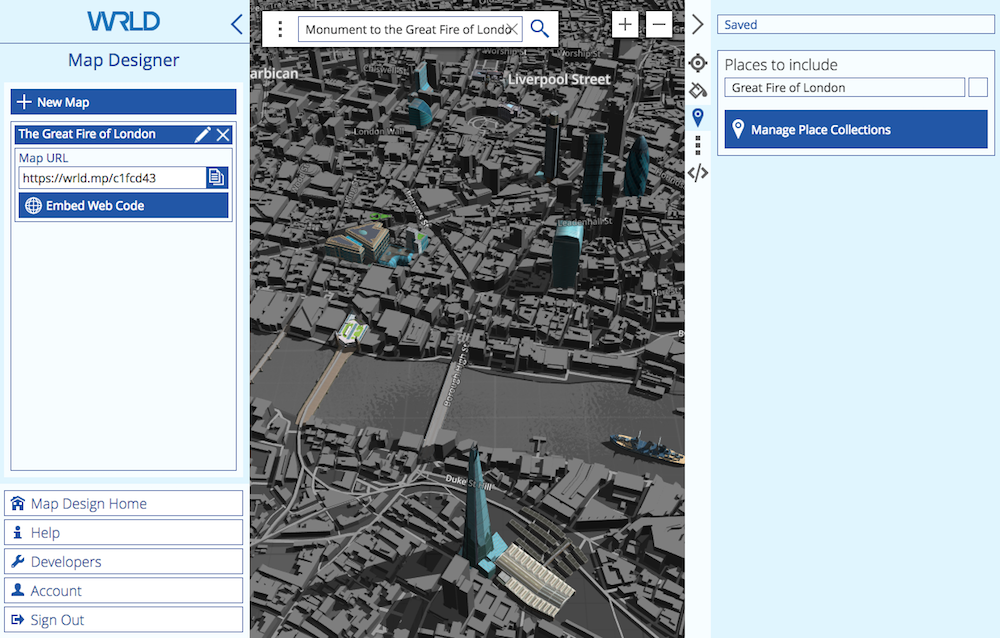
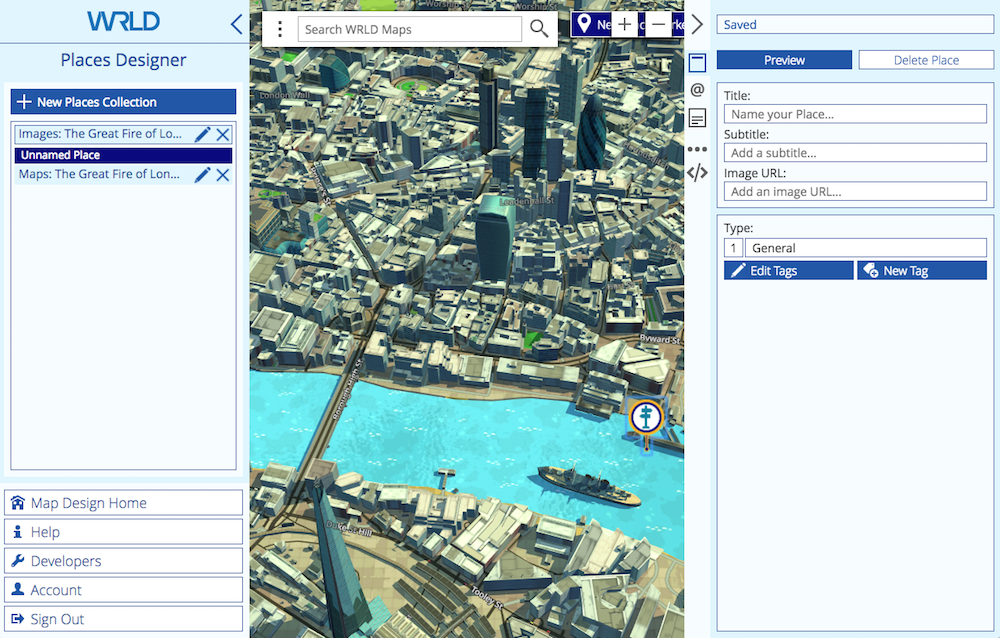
Now it’s time to add some places of interest. We do that from the Places Designer, which I can open (in a new browser tab) by clicking on the Places icon, then clicking Manage Place Collections.
Places Designer: Add Places of Interest and Location-Based Content
The Places Designer is now open. I can switch between it and the Map Designer simply by switching tabs in my browser.

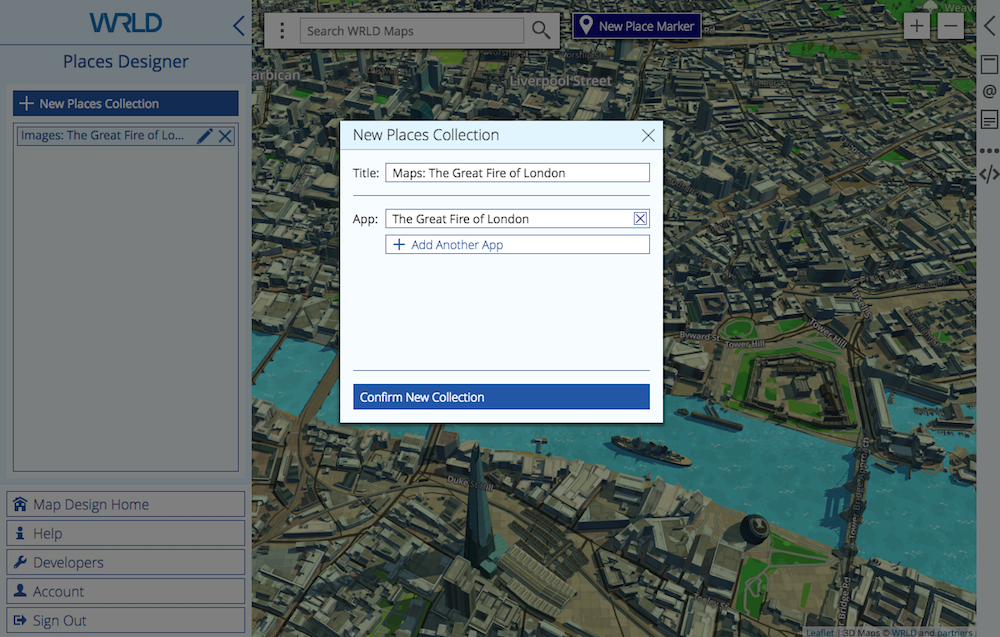
Before I add some places of interest to the map, I first need to create some Places Collections. These are containers for our places, and help us keep things organized.
I first need to have an idea about the content I’d like to add to the map. There’s a lot of interesting material about The Great Fire of London available online. Because the tragedy happened in 1666, there are obviously no photographs, but there are a surprising number of paintings available. To keep things simple for the purpose of this article, I’ll just use Wikipedia as a source.
The article includes a few maps of the spread of the fire over the four days, some contemporary paintings of the fire, and more. I decide to create just two collections, and make them available for my map by choosing “The Great Fire of London” under “app”:
- Images: The Great Fire of London
- Maps: The Great Fire of London
Now we’ll add some places of interest to each collection. Each place will add a pin to the map, and selecting the pin will display a card with additional content, including text and an image.
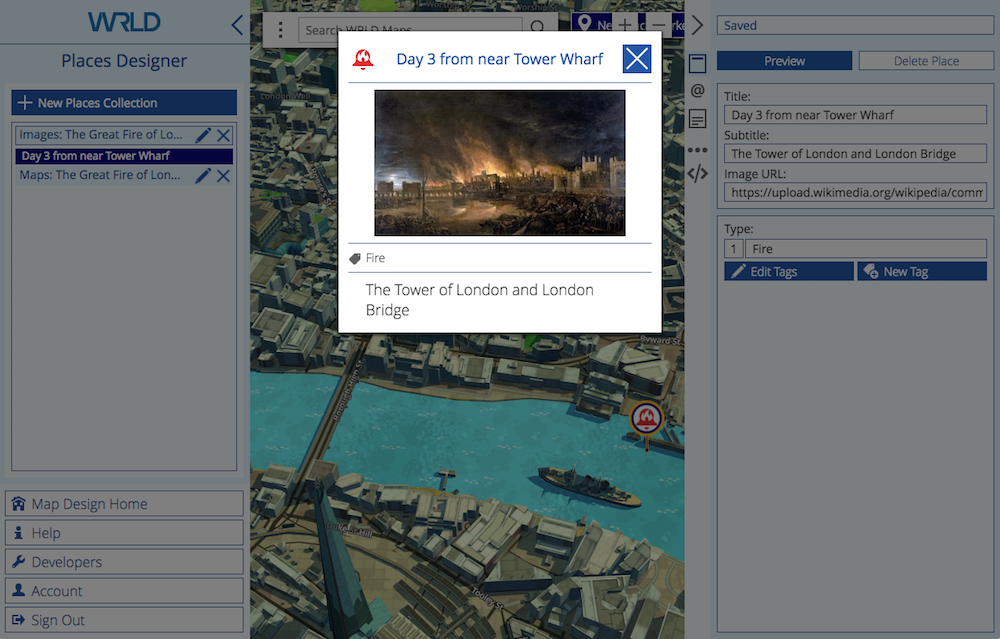
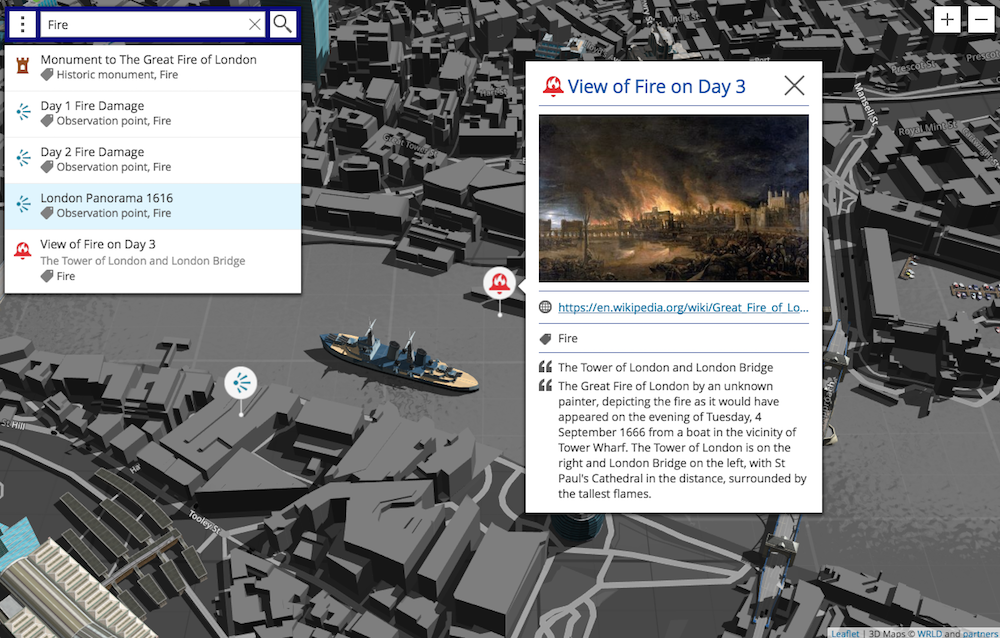
I’ll start with the first painting found in the Wikipedia article, which shows how the fire looked on the third day from near Tower Wharf on the Thames, just to the east of the fire. I want this to be in the “Images” collection, so I click on it, then New Place Marker. A pin is placed at the centre of the map, and I drag it to the vicinity of the wharf.
Now I fill in the form in the right pane, including a title, subtitle and URL to the image. I change the tag to “Fire”, which modifies the image on the pin. I preview the card, and it appears as in the screenshot below.
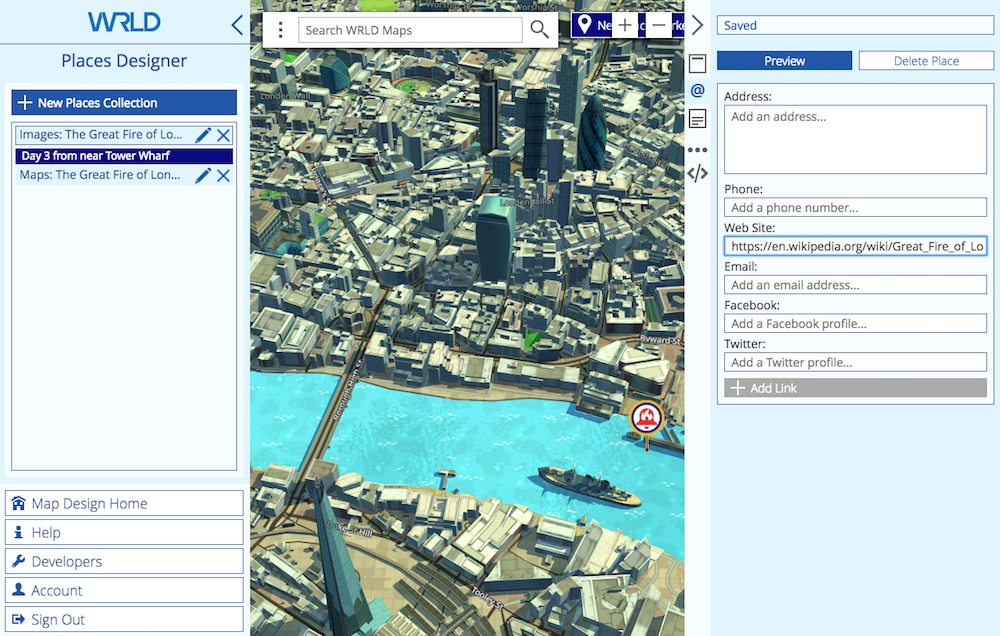
The next form in the right panel is for contact information. That’s not really needed for our use, but I did add a link to the Wikipedia article.
Next we can enter a description, which is a single paragraph of text content. I add the image description from Wikipedia, and preview the card.

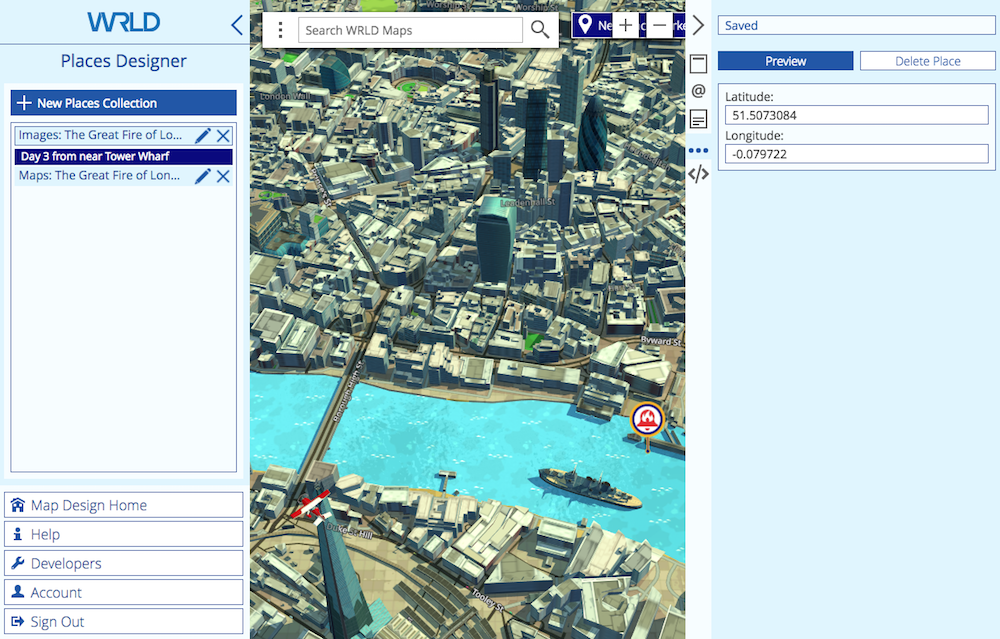
The next form allows you to fine tune the latitude and longitude of the pin. I’m not sure of the exact location of the painting, so leave it as it is.
The final form is a JSON editor, which is a little technical, and allows you to directly edit the data entered from the forms. If you don’t mind a bit of light technical work, it’s possible to further customize the card by adding HTML content. WRLD will release a video tutorial of how to accomplish this in the near future.
I add some more cards to our map using the same method, and it starts to take shape:
- Image: Ludgate on Fire
- Image: Monument to The Great Fire of London
- Image: View of Fire on Day 3
- Map: Day 1 Fire Damage
- Map: Day 2 Fire Damage
- Map: Day 3 Fire Damage

We’re almost finished. But before we share our map we need to return to the Map Designer to make our places of interest discoverable.
Finish and Share Your Custom 3D Map
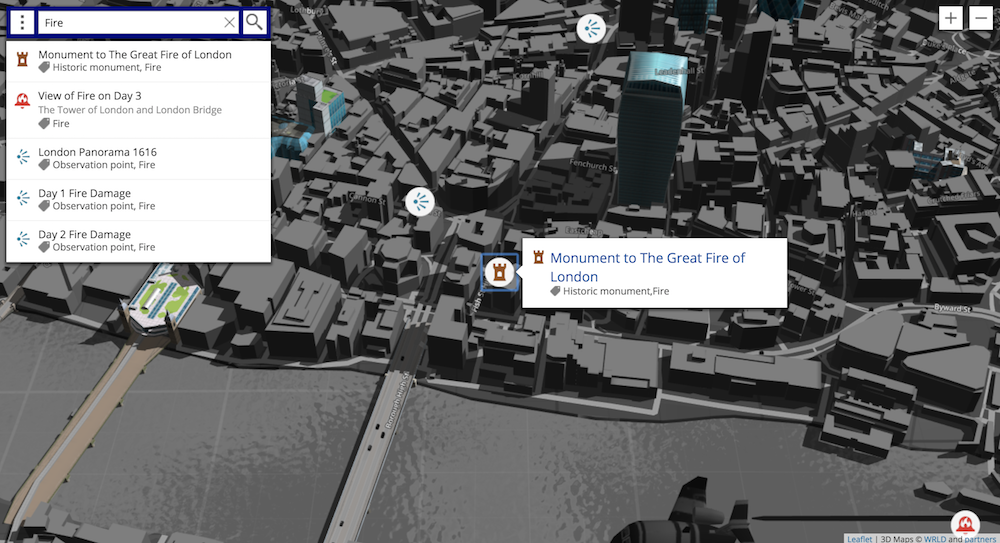
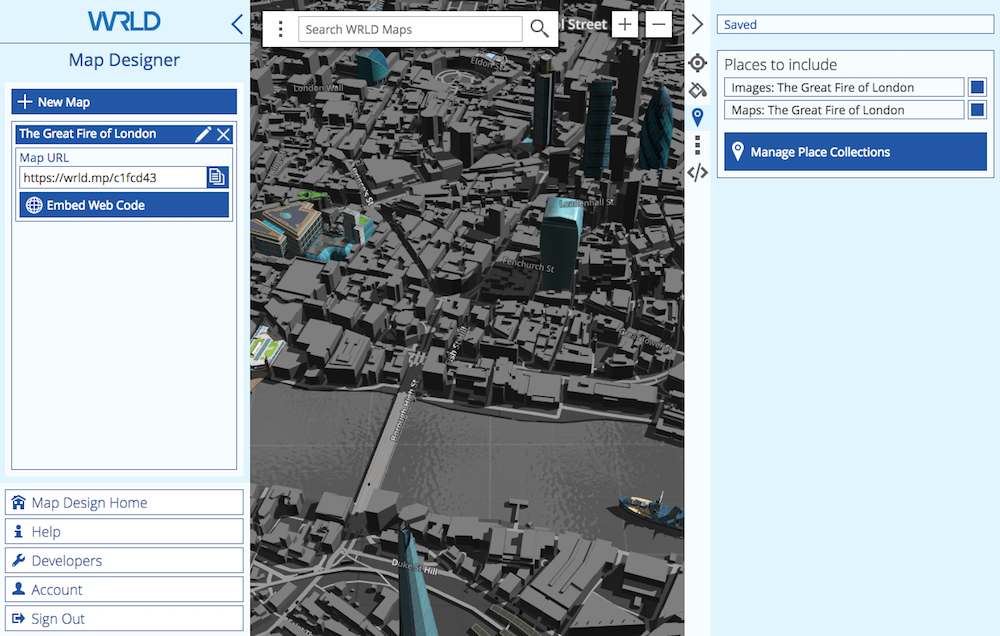
When we return to the Map Designer, we see that our places collections are marked for inclusion. That doesn’t make the pins visible automatically, but it does give us access to the items in a search.
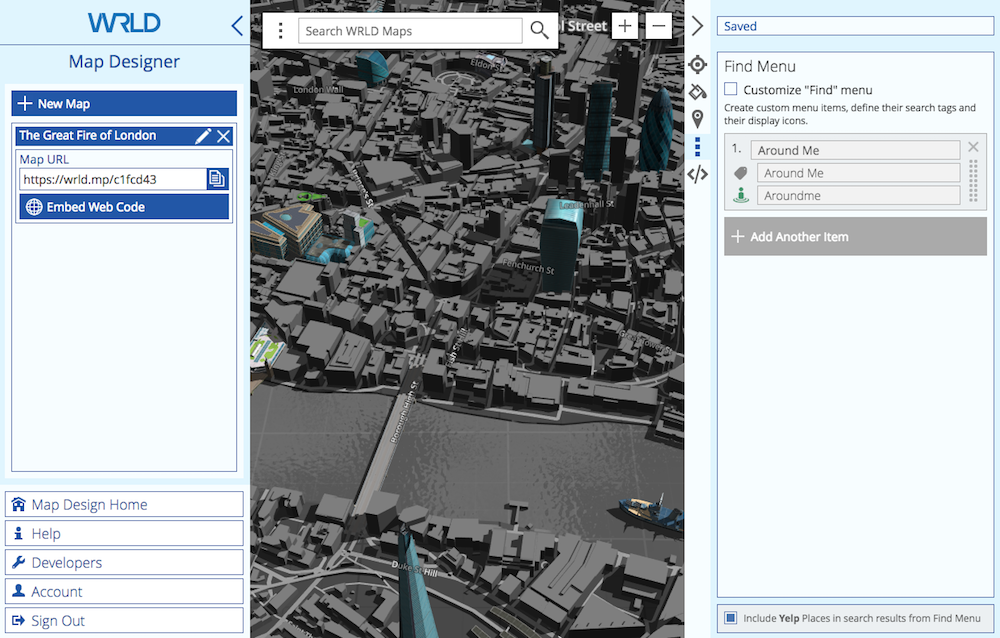
We can make them easy to find by customizing the Find Menu. This will allow our students to quickly find items on the map by clicking menu items that automatically search for a specific tag.
Since we only have a few places of interest on our map, I decide that a single search should find them all, so I go back to the Places Designer and add the “Fire” tag to each place of interest, then return.
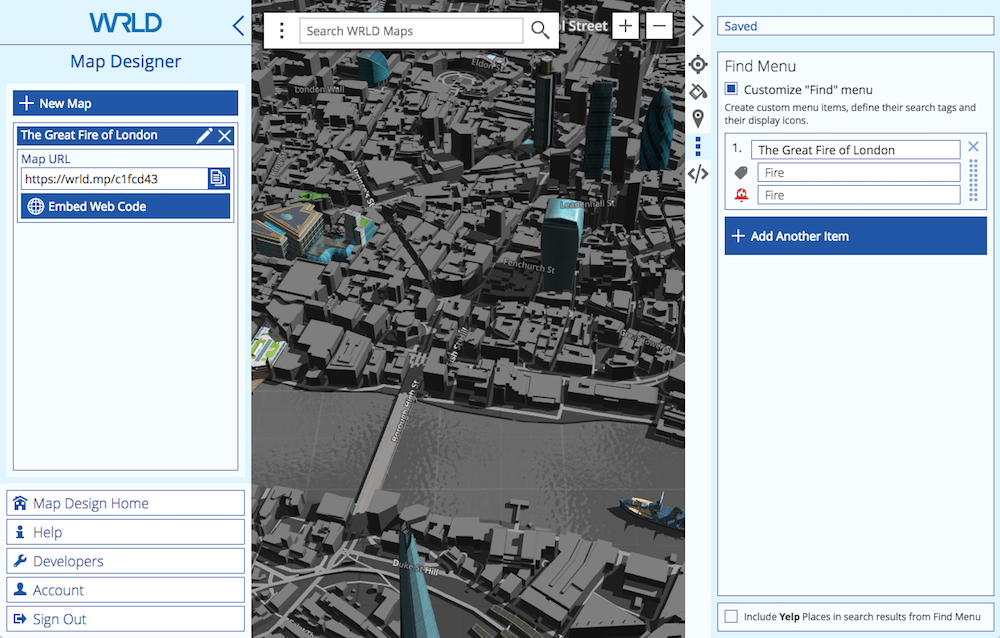
I check Customize Find Menu and add a new item: “The Great Fire of London”. I’ll have the menu item automatically search for the tag “Fire”, and represent the item with the “Fire” icon. At the same time I remove the item that WRLD had automatically added, and uncheck “Include Yelp Places in search results from Find Menu.”
Finally, the Map Designer also has a JSON Editor.
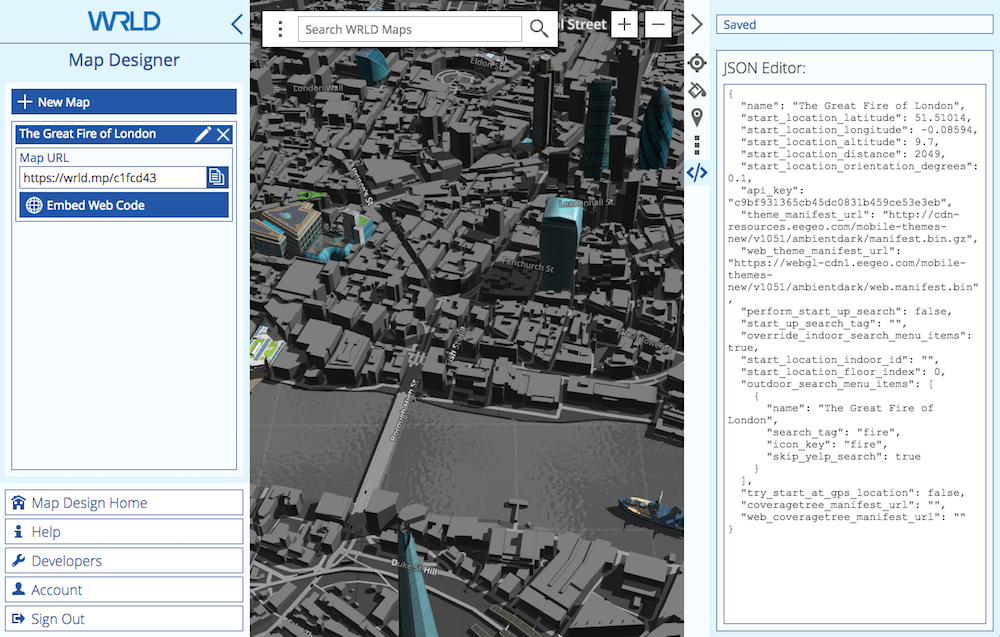
A few quick edits here will make our map much more useful by making our places of interest visible without manually doing a search first.
- First, I change
perform_start_up_searchto “true”. - Then I change
start_up_search_tagto “fire”.
Now whenever the map is opened, WRLD will automatically search for the “fire” tag and display the corresponding places of image as a search result. It will also displays the matching pins on the map. Clicking on a search result will scroll to the place of interest and display the card. WRLD notes that soon, users will not need to edit JSON to make these changes.
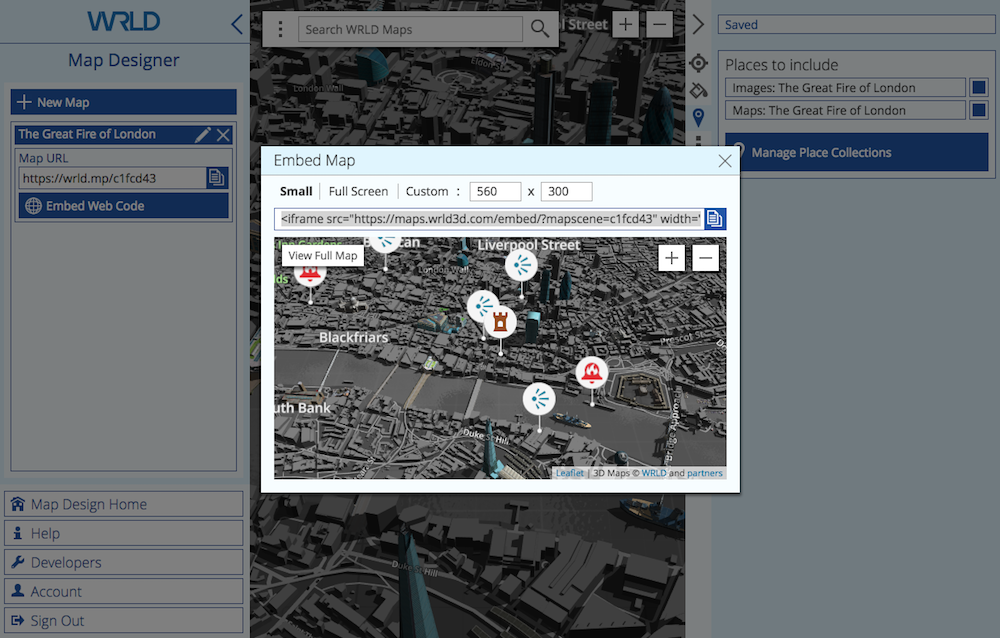
Finally, we need to make the map available to our students. We can do that by either sharing a clickable link to the map, which will open directly in the browser or direct mobile users to the app, or by embedding it as an iframe inside our online curriculum. Clicking on Embed Web Code displays a tool that lets you customize the size of the embedded map.
WRLD’s Map Designer allows you to create and share useful educational 3D maps without any coding. Students can explore your location-based content and visualize the material.
But be aware that, coding could enhance our map even further. For example, we could add polygons to indicate the area damaged by the fire each day, display hotspots using statistical data of casualties or the temperature of the fire, and we could color code buildings to indicate when they started to burn. If you’d like to learn more, check out Christopher Pitt’s more technical series on WRLD on the Web channel.