How to Draw Quadratic Bézier Curves on HTML5 SVGs

The article “How to Create Complex Paths in SVGs” examined the <path> element and showed how to draw a series of lines and arcs to create any shape. (It’s often used to replicate fonts without requiring a full font download.)
The d attribute offers a couple of extra tricks to draw smooth curves. In this article, we’ll discuss quadratic Bézier curves, but you can also refer to “How to Draw Cubic Bézier Curves on SVG Images” for a more complex option.
What are Quadratic Bézier Curves?
A quadratic curve has a start point (P0) and end point (P2). A single control point (P1) determines the curvature of the line. Wikipedia’s Bézier curve page provides a good generation illustration:
Math ninjas can also examine the migraine-inducing equations at WolframMathWorld.
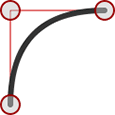
Quadratic curves are great for drawing smooth edges. As you can see from this image, it’s easy to specify a control point where a squared edge would normally appear:
Perplexing Paths
Quadratic Bézier curves are defined using a Q directive in the SVG path d attribute:
<path d="M100,250 Q250,100 400,250" />
The initial M directive moves the pen to the first point (100,250). Two coordinates follow the Q: the single control point (250,100) and the final point being drawn to (400,250).
You can also use a lowercase q to denote relative rather than absolute coordinates. The following curve would be identical and is possibly easier to code:
<path d="M100,250 q150,-150 300,0" />
Finally, there are shorthand T and t directives (as usual, the lowercase option denotes relative rather than absolute coordinates). These accept further ending coordinates to string multiple curves together. The control point is inferred from the last used to guarantee a perfectly smooth continuing curve. For example, take this path:
<path d="M100,250 Q250,100 400,250 T700,250" />
It draws a curve from 100,250 to 400,250 with a control point at 250,100. A further curve is drawn ending at 700,250 and the control point is inferred to be 550,400.
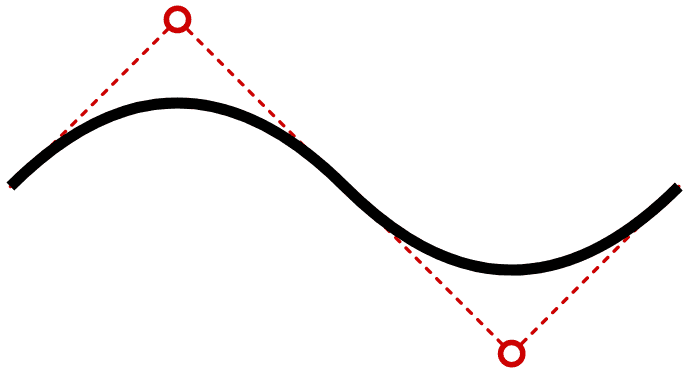
The inferred control point will be mathematically correct but may not always be what you require!
Quadratic Bézier curves can be a little difficult to code and visualize, so this quick generation tool will generate the <path> code for you:
See the Pen
SVG quadradic bézier curve path creation tool by SitePoint (@SitePoint)
on CodePen.
Drag the control point at either end of the curve accordingly. Click the curve itself to toggle a fill effect which adds an ending Z directive.
Note that this tool must convert DOM page coordinates to SVG coordinates to ensure it works at all screen sizes. This can be a little more complex than you expect, so refer to “How to Translate from DOM to SVG Coordinates and Back Again” for full details.
If you’re ready to tackle something more complex, try creating cubic Bézier curves on SVG images.


