Google Analytics API v3 and PHP: Filters and Charts

In the previous parts, we talked about how to use the Google Analytics API and created a demo showing some base functionality. In this part, we’re going to expand the demo.

New functionality
We’ll be adding some new functionality:
- Date range: we can query data from a specific date range.
- Max results: in the previous part we used 10 results for speed purposes, now we are going to take it as a user input.
- Filters: we can filter the result using some specific dimensions or metrics.
- Order: we can order the result using the queried dimensions.
- Chart type: this is not a Google Analytics functionality, but we’re going to make some prettier graphs using Highcharts.
Date range
For the date range selection we’re going to use bootstrap-daterangepicker.
First, we include the CSS and JS files and the dependencies.
// views/home.blade.php
<div class="form-group">
            <label class="col-sm-3 control-label" for="">Date range</label>
            <div class="daterange col-md-9">
              <input name="daterange" class="form-control" value="2013-01-01 - 2014-12-30">
            </div>
          </div>
We create the the date range component.
// views/home.blade.php

$('input[name="daterange"]').daterangepicker({
	   format: 'YYYY-MM-DD',
	   startDate: '2013-01-01',
	   endDate: '2013-12-31'
});
In our GA_service@report method we used the last month as our range date.
$now = new DateTime();
$end_date = $now->format('Y-m-d');
$start_date = $now->modify('-1 month')->format('Y-m-d');
Instead, we’re going to pass the start and end date as a parameter to the method after retrieving them on our HomeController@report.
$daterange = explode( ' - ', Input::get('daterange') );
$start_date = $daterange[0];
$end_date = $daterange[1];

$report = $this->ga->report( $view, $start_date, $end_date, $dimensions, $metrics );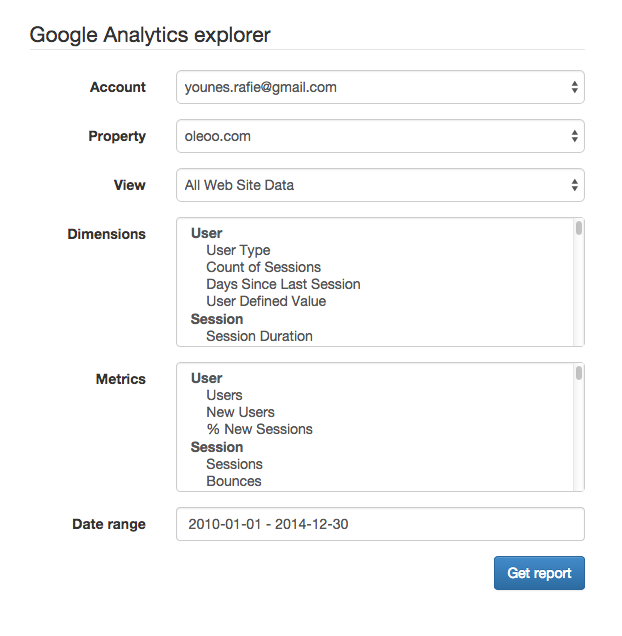
Max results
Our demo is taking only 10 results. We can make that configurable, or take it as a user input. The downside of this is the response becoming slow and taking too much to load, so you need to be prudent when using it.
<div class="form-group">
              <label class="col-sm-3 control-label" for="">Max results</label>
              <div class="col-md-9">
                  <input name="max_results" type="text" class="form-control" value="10">
              </div>
          </div>
After adding the input to our form, we can receive the max_results parameter in our HomeController@report method and pass it to the GA_Service@report method.
// HomeController@report
$max_results = intval( Input::get('max_results') );
$report = $this->ga->report( $view, $start_date, $end_date, $max_results, $dimensions, $metrics );
// GA_Service@report
$options['max-results'] = $max_results;
$data = $analytics->data_ga->get( $view, $start_date, $end_date, $metrics,
				$options
			);
Filters
In this section, we’re trying to filter the response using the selected dimensions and metrics.
Example:
ga:country =@morocco
(Only show countries that contain the word morocco)
Dimensions filter
In the previous part we explained how filters work:
ga:column operator value
So, we need to create the list of dimensions, a select option for the operator and an input for the value to be used in the filter.
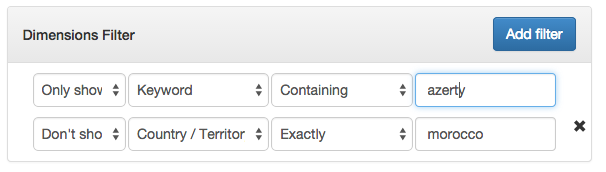
We also added a select for show or don’t show rule.
Back on the server side, we need to catch the user input. We can use JS to group the variable being sent to the server, but I’m trying to avoid any JS or ajax usage to keep the things server side.
I created a new file called GA_utils in our app/src folder. This is we’re we can put miscellaneous functions.
When posting the form this way, the request variables should look something like:
array(11) {
  ...
  ["dimension_filter_show"]=>
  array(2) {
    [0]=>
    string(4) "show"
    [1]=>
    string(5) "dshow"
  }
  ["dimension_filters"]=>
  array(2) {
    [0]=>
    string(10) "ga:keyword"
    [1]=>
    string(9) "ga:medium"
  }
  ["dimension_filter_rules"]=>
  array(2) {
    [0]=>
    string(7) "contain"
    [1]=>
    string(6) "regexp"
  }
  ["dimension_filter_values"]=>
  array(2) {
    [0]=>
    string(6) "azerty"
    [1]=>
    string(7) "morocco"
  }
}
To group each index with the matching ones, we use the following function.
// app/src/GA_utils.php

public static function groupFilters(array $show, array $filters, array $rules, array $values){
    $count = count($filters);
    $group_filters = [];

    for( $i = 0; $i < $count; $i++ ){
        // skip if no value is provided
        if( empty($values[$i]) )
            continue;

        $group_filters[] = [
            'show'      =>  $show[$i],
            'column'    => $filters[$i],
            'rule'      => $rules[$i],
            'val'       => $values[$i]
        ];
    }//for

    return $group_filters;
}//groupFilters
Now the result should become.
array(2) {
  [0]=>
  array(4) {
    ["show"]=>
    string(4) "show"
    ["column"]=>
    string(10) "ga:keyword"
    ["rule"]=>
    string(7) "contain"
    ["val"]=>
    string(6) "azerty"
  }
  [1]=>
  array(4) {
    ["show"]=>
    string(5) "dshow"
    ["column"]=>
    string(9) "ga:medium"
    ["rule"]=>
    string(6) "regexp"
    ["val"]=>
    string(7) "morocco"
  }
}
Now that we have a clean input from the user we can proceed to encode the filters before sending them.
public static function encodeDimensionFilters( $filters ){
   $url = [];

   foreach ($filters as $filter) {
       $operator ="";
       if( $filter['rule'] == "contain" ){
           if( $filter['show'] == "show" )
               $operator = '=@';
           else
               $operator = '!@';
       }
       else if( $filter['rule'] == "exact" ){
           if( $filter['show'] == "show" )
               $operator = '==';
           else
           $operator = '!=';
       }
       else if( $filter['rule'] == "regexp" ){
           if( $filter['show'] == "show" )
               $operator = '=~';
           else
               $operator = '!~';
       }

       $url[] = "{$filter['column']}{$operator}{$filter['val']}";
   }//foreach

   $uri = implode( ";", $url );
   //$uri = urlencode($uri);

   return $uri;
}//encodeDimensionFilters
This function will take the previous filter array and encode it as ga:column operator value. It will separate them using a semicolon (which means and – a comma is or).
At this point, our HomeController@report method will use previous methods.
$filters = [];
$group_filters = [];
$group_filters['dimensions'] = GA_Utils::groupFilters(                        	Input::get('dimension_filter_show'),                          Input::get('dimension_filters'),                       Input::get('dimension_filter_rules'),				                                                     Input::get('dimension_filter_values')
);

$filters[] = GA_Utils::encodeDimensionFilters( $group_filters['dimensions'] );
You can visit the documentation for more in depth explanation.
Before testing the filters, I will create the necessary code for the metrics filter and we can test everything at once.
Metrics filter
The metrics filter is the same as the dimensions one, except that the columns are from a metrics list and the operators are mathematical.
$group_filters['metrics'] = GA_Utils::groupFilters(
            Input::get('metric_filter_show'),
            Input::get('metric_filters'),
            Input::get('metric_filter_rules'),
            Input::get('metric_filter_values')
        );
        $filters[] = GA_Utils::encodeMetricFilters( $group_filters['metrics'] );

$filters = implode(';', $filters);
After getting and encoding the filters we implode the dimension and metric filter with a semicolon (and operator).
NOTE: dimension and metric filters cannot be combined using a comma (or operator).
Now our filter should give us something like:
// show countries containing the word morocco and page views are greater than 100

ga:country=@morocco;ga:pageviews>100
We will add the encoded filter and pass it to the GA_Service@report as a parameter.
Google Analytics API accepts the encoded filter as an option, like max_results, etc.
// app/src/GA_Service@report
$options['filters'] = $filters;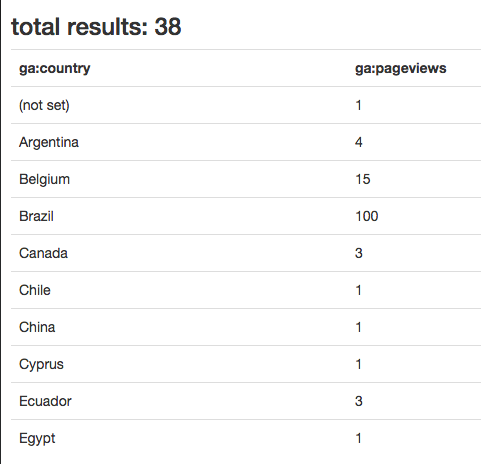
I got this result without using a filter.
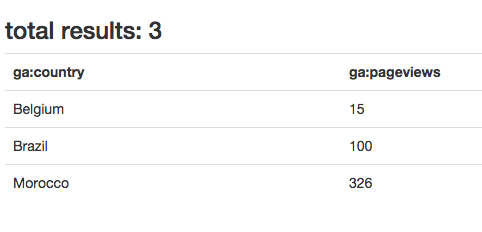
In this screenshot I’m using a filter:
- Don’t show
(not set)country! - Show only page views greater than 10.
Ordering results
Google Analytics gives us a nice way to sort results:
ga:country,-ga:pageviewsWe can order by dimensions or metrics. In our demo, I will use only one select list containing all metrics and dimensions.
// app/views/home.blade.php

<div class="col-md-7 nopadding">
	<select class="filter_columns form-control" name="orderbys[]">
        @foreach( $dimensions as $key => $group )
          <optgroup label="{{ $key }}" >
          @foreach( $group as $dimension )
            <option value="{{ $dimension->id }}">{{ $dimension->attributes->uiName }}</option>
          @endforeach
          </optgroup>
        @endforeach

        @foreach( $metrics as $key => $group )
          <optgroup label="{{ $key }}" >
          @foreach( $group as $metric )
            <option value="{{ $metric->id }}">{{ $metric->attributes->uiName }}</option>
          @endforeach
          </optgroup>
        @endforeach
    </select>
</div>

<div class="col-md-4 nopadding">
    <select class="form-control" name="orderby_rules[]">
        <option value="">ASC</option>
        <option value="-">DESC</option>
    </select>
</div>
After submitting the form we need to group and encode the list of order by rules.
// app/src/GA_Utils.php

public static function groupOrderby(array $orderbys, array $rules){
    $count = count($orderbys);
    $group_orderbys = [];

    for( $i = 0; $i < $count; $i++ ){
        $group_orderbys[] = [
            'column'        =>  $orderbys[$i],
            'rule'          => $rules[$i]
        ];
    }//for

    return $group_orderbys;
}//groupOrderby

public static function encodeOrderby( $orderbys ){
    $res = [];

    foreach( $orderbys as $orderby ){
        $res[] = $orderby['rule'] . $orderby['column'];
    }//foreach

    return implode( ',', $res );
}//encodeOrderby
Inside our HomeController@report we will encode our order by inputs.
// app/controllers/HomeController@report

$orderbys = GA_Utils::encodeOrderby( GA_Utils::groupOrderby(Input::get('orderbys'), Input::get('orderby_rules') ) );
Google Analytics API accepts the encoded order by as an option.
// app/src/GA_Service@report

$options['sort'] = $orderbys;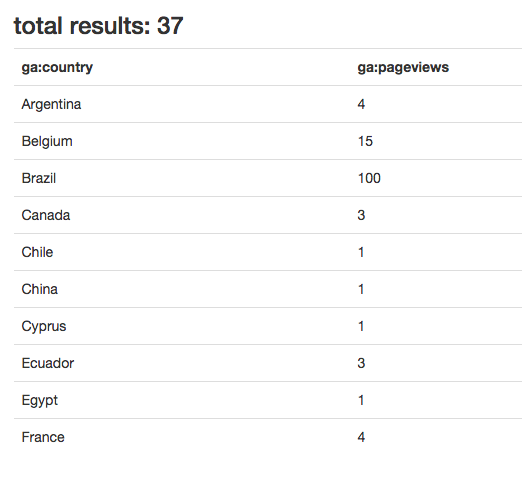
In this screenshot, I eliminated the (not set) country and sorted by country. You can read more about sorting results in the docs.
Using charts
This part is not related to Google Analytics API, but if you’re using the Google Analytics Service, you noticed those fancy charts. In this part, I will be using Highcharts, and I will use the pie chart example from their demo.
To draw a pie chart we need a name and a y axis array.
[
	{
		"name":"(not set)",
		"y":"1"
	},
	{
		"name":"Argentina",
		"y":"4"
	},
	{
		"name":"Belgium",
		"y":"15"
	},
	{
		"name":"Brazil",
		"y":"104"
	}
	...
]
Let’s start by adding a new select option list containing a pie and table chart options.
On our server, we will only create a JSON representation of our report data.
$json_data = [];
foreach( $report['items'] as $item ){
    $json_data[] = [
        'name'  => $item[0],
        'y'     => $item[1]
    ];
}//foreach

return View::make('report', [
		'columns'       => $report['columnHeaders'],
        'items'         => $report['items'],
        'totalResults'  => $report['totalResults'],
        'report_json'   => json_encode($json_data),
        'chart_type'    => Input::get('chart_type')
]);
The only remaining part is to catch those values inside our view. We test if the user wants a table or a pie .
@if( $chart_type == 'pie' )
<div class="pie">
    <div id="pie_canvas"></div>
</div>
<script src="http://code.highcharts.com/highcharts.js"></script>
<script>
     $(function(){
         var el = $("#pie_canvas"),
             serie_data = {{ $report_json }};
      el.highcharts({
          chart: {
              plotBackgroundColor: null,
              plotBorderWidth: 1,
              plotShadow: false
          },
          title: {
              text: ''
          },
          tooltip: {
              pointFormat: '{series.name}: <b>{point.percentage:.1f}%</b>'
          },
          plotOptions: {
              pie: {
                  allowPointSelect: true,
                  cursor: 'pointer',
                  dataLabels: {
                      enabled: true,
                      format: '<b>{point.name}</b>: {point.percentage:.1f} %',
                      style: {
                          color: (Highcharts.theme && Highcharts.theme.contrastTextColor) || 'black'
                      }
                  },
                  showInLegend: true
              }
          },
          series: [{
                      type: 'pie',
                      name: '',
                      data: serie_data
                  }]
      });//highchart
 });
</script>
@else
	// print the table here
@endif
First, we include the highchart.js file, then we use some configuration from their documentation. The important part is the serie_data = {{ $report_json }}.
Inside our controller, we created an array of values, and then we encoded those values to be used in our JS.
Note: when choosing the pie chart you need to choose only one metric and one dimension, or you would have to extend the demo and use the drill down functionality provided by highchart.
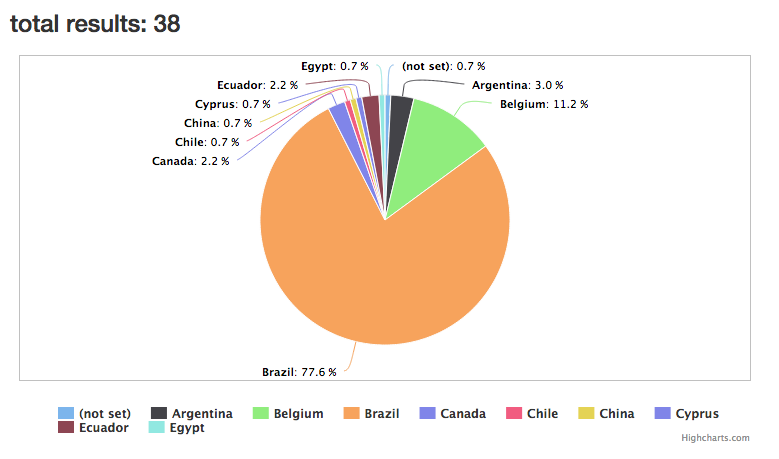
Running the previous code will give a result like this.
Conclusion
In this part, we explored some more of Google Analytics API, demonstrating its power and customizability. Most of the API is used on the Google Analytics Query Explorer and can be explored that way. Let me know what you think about the API and this tutorial, and feel free to check out the final repo to test the demo.